Reports are the foundation of any study. They help you understand your or your organization’s performance and develop effective strategies. Moreover, it is non-negotiable to create solid reports that show a clear perspective for making wise decisions in today’s data-driven society.
But how do you do that effectively? The answer is simple – by creating your reports using Excel. Why, you ask? Well, Microsoft Excel’s capacity for data management, analysis, and visualization offers a special platform for turning unstructured data into insightful knowledge.
Learning how to create a report using Excel can open up a world of information. So, this blog post is here to explore various types of reports Excel can help you with, the importance of marketing reports, a step-by-step guide to report creation and the benefits of leveraging automation tools like ViewMetrics for enhanced efficiency.
Let’s begin!
Types of Report You Can Produce Using Excel
Excel is a flexible reporting platform that can generate a variety of report formats. It is more than just a tool for crunching numbers. Let’s examine the several types of reports you can create:
- Reports on Sales and Marketing: Reports on sales and marketing are essential for comprehending consumer behavior and evaluating the success of different initiatives. You may find trends and develop marketing plans that successfully connect with your audience by examining sales performance in conjunction with customer data.
- Reports on Finances: Important information, including income, expenses, assets, liabilities, and cash flow, is all included in financial reports. You can obtain a thorough picture of your financial situation by creating these reports in Excel. It helps you make wise budgetary decisions and forecast with accuracy.
- Customized Reports: Excel gives you the ability to design reports that are specifically suited to your needs. You can create reports that highlight particular metrics or queries by integrating multiple datasets and making use of sophisticated features.
- Data Analysis: Excel gives you the ability to condense complicated datasets into data analysis reports. You can do statistical studies to obtain actionable insights and visualize trends that guide corporate strategies.
- Reports on Operations: You can keep a careful eye on important areas of your company, such as production, inventory, and project progress, with the use of operational reports. These reports help with effective operational management in addition to tracking HR data.
The Benefits of Using Excel to Create Marketing Reports
Excel is an ideal tool to generate all types of reports. However, there are specific benefits to utilizing Excel to create a marketing report. The following are some of them:
- Adaptable Reporting: Excel offers countless customization choices for reports to satisfy various marketing requirements. To make sure you get the most important insights, you can create reports that concentrate on particular variables, such as website traffic or conversion rates.
- Fast Analysis: Excel’s user-friendly features allow you to quickly analyze data and get insights into how well your campaign is performing. When you create a marketing report using Excel, it becomes easier to take decisive action without losing out on important opportunities, thanks to the speed at which data is processed.
- Data Clarity: Graphs and charts improve understanding and make your reports look nicer. Excel’s visualization capabilities can greatly enhance team knowledge by turning unstructured data into clear visuals.
- Economical Data Manipulation: Excel can manipulate data without breaking the bank, so why spend a fortune on specialized software? It is an affordable option that enables you to obtain crucial knowledge without needing a sizable cash commitment.
- Accessible Evaluation: Excel’s broad accessibility is one of its best qualities. The ability to access your marketing data from almost any location simplifies the analytical process for stakeholders, teams, and organizations.
How to Create a Report Using Excel?
Here’s a step-by-step guide for generating a detailed, smart, and unambiguous report in Microsoft Excel:-
Step 1: Make a Report Plan
- Start by outlining the goal of the report.
- Are you tracking project progress, creating a budget summary, or performing a sales analysis?
- Choose the most important metrics and data items to provide after you have clarified the goals.
- Think about the format of the report: will it include charts, tables, or summaries to make it easier to read?
Step 2: Data Import and Organization
- This step comprises importing and arranging your raw data for analysis.
- Use Excel’s “Get & Transform” tool to import the required data files.
- By eliminating duplicates and efficiently handling missing information, Excel aids in data cleaning and formatting.
- To facilitate processing and analysis in later stages, organize this data using tables.
Step 3: Analysing Data With Excel Functions
- You can improve your data analysis by using Excel’s built-in functions.
- Fundamental information can be obtained using simple formulas like SUM, AVERAGE, and COUNTIF.
- Logical operations like IF, VLOOKUP, and INDEX-MATCH also aid in carrying out more intricate analyses.
- To ensure accuracy and consistency, use data validation techniques.
Step 4: Data Visualizations
- Convert your data into eye-catching visuals.
- You may efficiently represent your data by creating different chart formats, such as pie, line, or bar charts.
- Because they let you delve into precise details, pivot tables are incredibly useful for dynamic analysis.
- For intuitive insights, use conditional formatting to emphasize material that needs to be addressed right away.
Step 5: Prepare the Report
- Making a report look appealing requires careful formatting.
- Use cell formatting tools like borders, colors, and fonts.
- For consistency, be sure to include headers and footers.
- You can also use page configuration settings to make your reports print-friendly.
Step 6: Configure Excel Features to Automate Reports
- Consider applying macros, which automate specific functions within your report, to save time on repetitive activities.
- Updating data guarantees that your reports show the most recent information.
- Linking data from many sheets can provide coherent results.
Step 7: Make a Dashboard (Selective)
- Dashboards give you a high-level overview of your data at a glance by combining many charts, tables, and summaries onto a single page.
- By linking to comprehensive sheets with navigation buttons or hyperlinks, you may improve your dashboard even further.
Step 8: Examine and Complete
- Once your report is finished, make sure all of your datasets are consistent and that your calculations are accurate.
- Verify the text’s clarity by proofreading it.
- Lastly, save your file in the preferred format (such as.xlsx or.pdf).
Step 9: Sharing of the Report
- Here comes the time for your labor to generate some fruits – Share your report at the end.
- You can go either way – share it by exporting it as a PDF or by sharing the Excel file directly.
- Use the Protect Sheet or Protect Workbook options under the Review tab to limit unauthorized alterations if confidentiality is an issue.
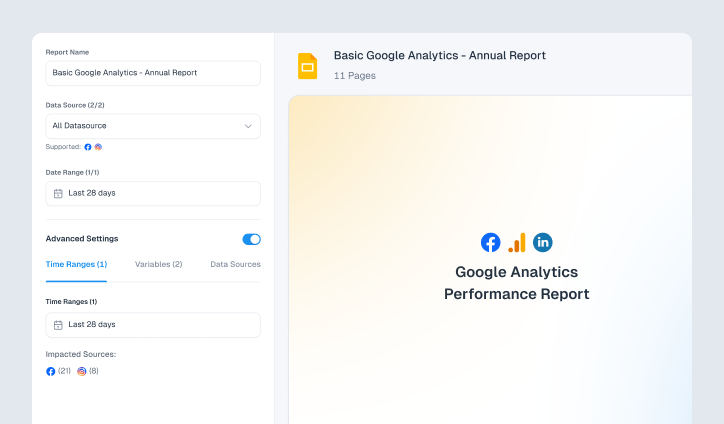
Do You Want to Skip the Hassle? Generate Automated Marketing Reports with ViewMetrics
With ViewMetrics, streamlining your marketing analysis has never been simpler. Automated reporting is the way of the future. The inconveniences of manual reporting can be avoided by utilizing this effective solution.
ViewMetrics makes it easier to create automated marketing reports, freeing you up to concentrate on meaningful insights rather than tedious data collection.
Ready to Get Amazed? Try it now!

Gaining proficiency with Excel tools can improve your reporting abilities and provide your company with success-driven insights. There is always more to discover in the enormous universe of data.
As you become more comfortable with creating a report using Excel, you can think about exploring more complex choices like Power Query for complex data manipulation and Excel add-ins for specific reporting needs.
Investigate, educate yourself, and maintain your lead in the ever-changing field of data reporting!
Frequently Asked Questions (FAQs)
How can I get data from outside sources into Excel?
To easily import from CSV files, databases, or other Excel files, use the “Get & Transform” tool located under the Data tab.
How can conditional formatting be used?
Choose the pertinent information – select the Home tab – select “Conditional Formatting,” and create rules that draw attention to the important details you require.
How can I make a chart in Excel the simplest way possible?
Choose a chart type that best suits your reporting requirements after you have highlighted your data and navigated to the Insert tab.
Is it possible to automate the creation of reports in Excel?
Of course! Power Query and Macros can be used to automate the creation of your reports effectively.
How can I prevent someone from altering my report?
The “Protect Workbook” and “Protect Sheet” choices are available under the Review tab.
How can I automatically update the data in my report?
Make sure your report has the most recent data by setting up data connections and clicking the “Refresh All” button.
Can I use Excel to create an interactive dashboard?
Yes, you can apply dynamic charts, slicers, and pivot tables to create interactive dashboards that improve user engagement. You can produce engaging experiences by doing this.


Work smarter by automating client reports now
Get Started for free
Design That Stands Out
Elevate visuals effortlessly with customizable styling options tailored to match brand aesthetics.
Effortless Data Syncing
Keep insights up-to-date with seamless and flexible data synchronization across platforms.
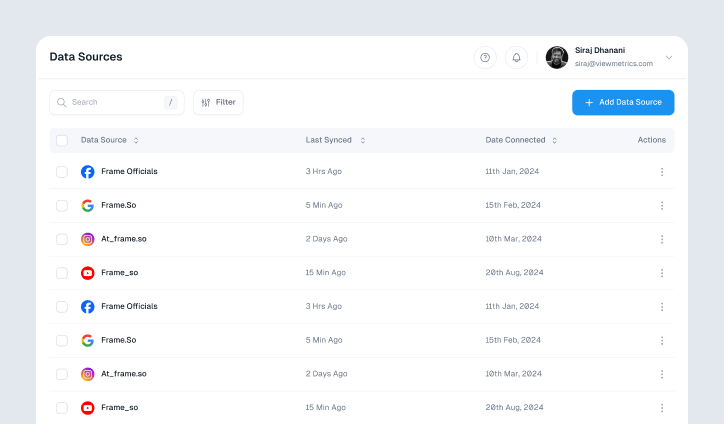
Connect with Ease
Integrate effortlessly with leading platforms to streamline workflows and maximize efficiency.

Boost Productivity with Google Add-On
Access powerful tools directly within Google Workspace for seamless marketing reporting.
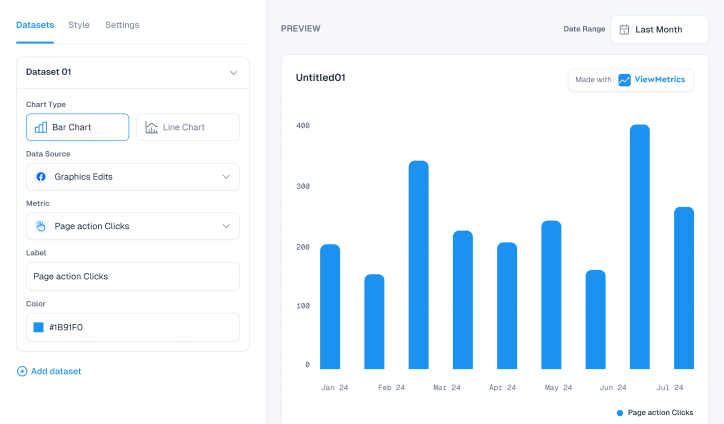
Custom Reports, Instant Insights
Generate tailored marketing reports effortlessly, delivering key insights in just a few clicks.
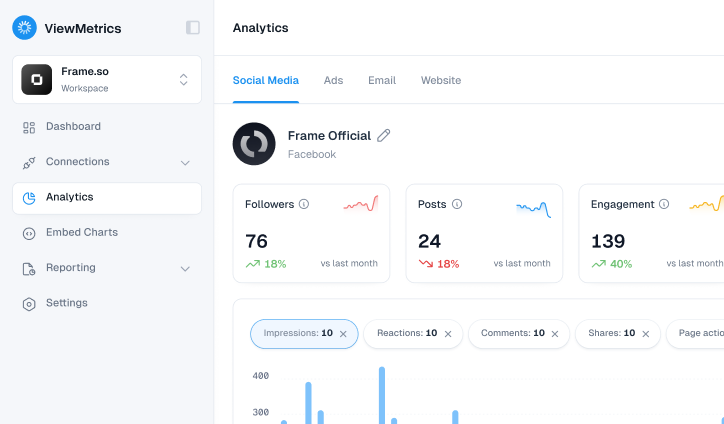
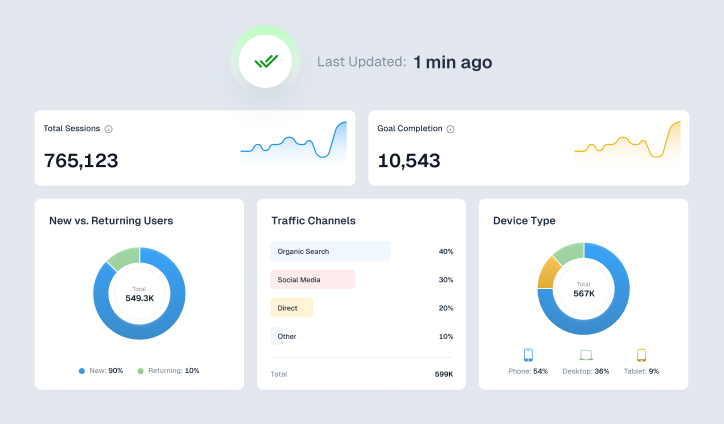
Actionable Analytics at a Glance
Access in-depth analytics to uncover trends, optimize strategies, and drive impactful decisions.

Collaborate with Ease
Invite team members to share insights, streamline workflows, and work together seamlessly.
Design That Stands Out
Elevate visuals effortlessly with customizable styling options tailored to match brand aesthetics.
Effortless Data Syncing
Keep insights up-to-date with seamless and flexible data synchronization across platforms.
Connect with Ease
Integrate effortlessly with leading platforms to streamline workflows and maximize efficiency.
Boost Productivity with Google Add-On
Access powerful tools directly within Google Workspace for seamless marketing reporting.
Custom Reports, Instant Insights
Generate tailored marketing reports effortlessly, delivering key insights in just a few clicks.
Actionable Analytics at a Glance
Access in-depth analytics to uncover trends, optimize strategies, and drive impactful decisions.
Collaborate with Ease
Invite team members to share insights, streamline workflows, and work together seamlessly.