Creating an analytical report can be a pain most of the time. With the workload you must already be swimming in, the additional task of making an analytical report can come with the cost of your mental peace as you try to piece in every data figure. But when done systematically, analytical reports need not be a hassle!
What is an Analytical Report?
In simple terms, an analytical report is a form of a business report that includes all the data a business can use to study and evaluate its business strategy. These reports come in handy when businesses need additional help to support more business-related decisions, find opportunities, and resolve issues. Here’s a short example:
Let’s suppose the marketing team wants to implement a new marketing strategy. But how do they know this strategy is worth investing money in? How do they get the idea that this new strategy will help the business come in with leads and sales? The best way for them to predict that this strategy may work is by analyzing the present strategy and its data, which can be done by creating an analytical report.
Now, what needs to be included in an analytical report to make it valuable? The most important thing to include is crucial data that can be added through extensive research. And not just the facts and figures, to prove your point, you must also include solid recommendations or suggestions to ensure that the trends and data you have collected will surely work.
3 Different Types of Analytical Reports
As you now know what is an analytical report, it’s time to understand the three different types of analytical reports, what they are, and why they are important:
1. Descriptive Analytical Report
The first type of analytical report has to be the descriptive analytical report. This type of report is more focused on studying historical data. When you study this data, you can uncover some patterns, trends, and characteristics your previous datasets must have followed, causing a certain failure or success for that particular campaign or quarter.
But, descriptive-analytical reports, as the name suggests, are descriptive and heavily focused on facts and figures, making them seem tedious to read. Now, how to break down this monotonous data?
To break down the large volume of data accumulated in this type of report, you can use advanced statistical methods, apply visual representations, and show some relevant KPIs (Key Performance Indicators). This provides a clear snapshot of the organization’s current success situation and what has already happened in the business.
But is a descriptive analytical report important? Yes, absolutely! This report allows businesses to make more informed decisions by revealing patterns through the data drawn. Managers can take a look at the bigger picture, understand how well the business is performing, and even point out improvements where needed.
Further, stakeholders can communicate this descriptive-analytical data to people within and outside the company to scrutinize profit, revenue, debt metrics, and cash flow.
2. Diagnostic Analytical Report
A diagnostic analytical report is a deeper dive into the question of “Why did this happen to the business?” Businesses can better understand the reasons behind the patterns they have noticed during descriptive analytical report reading. They get to investigate the trends happening in the organization, these trends that are behind the success or failure of a certain campaign or quarter.
When making a diagnostic analytical report, techniques like data mining and drilling can be used. These techniques often involve looking at extra data sources, including external ones, to discover the cause behind any shifts happening in the business. To effectively analyze this data, you might also be leveraging tools and techniques covered in articles like Data Tracking or Data Blending.
How is a diagnostic analytical report important, you may ask? Well, with this type of report, a business benefits as it better understands its performance. Once stakeholders know the inside-out of the performance of their business, they can work on the problems and even repeat trends that led to success.
Here’s a simple example: if a particular marketing campaign has led to higher sales of a product, a company can allocate more resources towards this campaign and even create similar campaigns for other products.
3. Predictive Analytical Report
A predictive analytic report, as the name suggests, is best for predicting the future outcomes of a business by analyzing the present and past data. When analyzing this data, you can better understand the outcomes these patterns may bring, hence helping you learn whether to adopt the same methods or not.
The best example of a predictive analytical report being used by a business is during the launch of new products. Businesses can optimize their operations according to the previous and current data and predict the success ratio of their new products.
Even online retailers can use a predictive analytical report to refine product recommendations and boost sales. This aligns with concepts like Predictive Marketing and Machine Learning Marketing.
The greatest advantage of this type of report is that businesses can reduce their risk factors. For example, businesses can use their predictive analytical report to predict the failure or success of a product launch depending on the data shown in a predictive analytical report and, hence, keep their costs low.
Examples of Analytical Reports
Below are some examples of analytical reports:
1. Financial Report
The main use of a financial report is done by the finance team to understand the company’s finances better. They might use an analytical report to keep track of the reasons why the company might be producing more or less money this quarter compared to previous quarters.
2. Operational Report
An operational report is a great example of an analytical report used by the operational manager to draw analysis and improve the organization’s operational performance. With an analytical report, the operational manager can come up with an operational analysis and draw ways in which the company can work to promote productivity.
3. Trend Analysis Report
A trend analysis report is used by the company analysts to study the market trends and come up with their trend analysis. This can be used to stand out from the competitors. Company analysts can then work on new products and learn consumer preferences by concluding the trends seen in this report. This often ties into Market Intelligence.
How to Write an Analytical Report?

Here’s how to write an analytical report without making it seem like rocket science:
1. Identify the Issue
Identifying the problem is the first step toward making an analytical report. This can assist in developing an outline for the report.
2. Gather Information
After identifying the issue, it’s time to gather relevant data or information. This includes gathering data on your rival’s performance or researching the current state of your industry’s market.
3. Select a Report Format
Next, you are presented with several choices when presenting your report. This includes presenting it in the form of documents, spreadsheets, and presentations. You can also explore Marketing Reports and Dashboards vs. Reports for more format insights.
4. Add Visual Elements
Who said an analytical report is only clumped up with boring data and figures? The key to making it interesting is to add visual elements like graphs, charts, and other visual aids. You can use plots, maps, bar charts, line charts, and other elements like photos and icons to make your analytical report more visually striking.
5. Implement Design Practices
While adding visual elements is important, don’t forget to follow basic design practices that can make any analytical report clutter-free and easy to read. Add sufficient white space to the layout for a neat look. You can even implement a clear layout that combines images and texts.
6. Draw Main Conclusion
Recommendations and results should be your last step in analytical report writing. This includes the main conclusion of your report, which summarizes its main points.
Analytical Report Format
Whether you choose a descriptive, diagnostic, or predictive analytical report, there’s a basic format to follow to streamline the process:
- A title page: Begin your analytical report with a title page that describes the title of the topic and the type and purpose of the report.
- Table of contents: Here, you have to add each section’s title and page number in a chronological manner.
- Introduction: This section will talk about the objectives of your report, the reason behind the topic selection, the importance of the study, and the techniques you have employed to draw the data in this report.
- Executive summary: This includes a short and clear summary of the objectives, key findings, methodology, and recommendations that will be mentioned in your analytical report.
- Methodology: Methodology means describing the data sources and methods you used in the analytical report.
- Findings and analysis: Your findings and analysis are the main core of your report where you need to present analysis, data, and interpretation in a well-structured manner.
- Conclusion: The end of your analytical report should have a conclusion that clearly summarizes the key insights drawn from the analysis.
- Recommendations: Recommendations here mean the actionable steps you can take to bring the data to use. This section is important for taking action toward success.
- Appendices: Appendices are supplementary materials that are not essential but relevant to the main analysis. This includes technical notes or data tables.
How ViewMetrics Help to Create Analytical Reports?
Adapting a new strategy is important in any business to keep it running smoothly. But before diving into the strategy, you cannot forget to analyze previous and current trends and patterns the business is following due to the ongoing campaigns. Hence, it’s important to come up with an analytical report.
But it can get tedious at times, especially when you and your team are swimming in other workloads. Leave the task of making detailed marketing reports to the experts!
ViewMetrics can help you by creating reports using the right amount of automation! Simply connect your marketing accounts to our platform, select your desired template, and leave the rest to us.
Frequently Asked Questions (FAQs)
How can I decide which KPIs are the most relevant for my analytical report?
Selecting the important KPIs for your analytical report is important. To begin with it, dig into your target audience, business goals, and report’s purpose. For example, operation-related metrics might be useful to department heads, while financial KPIs of the analytical report are more useful for the CFO.
How often should analytical reports be updated to stay relevant?
The frequency of analytical report updates depends on the data trends and the type of the report. For example, marketing reports may require real-time tracking or weekly updates, while financial reports may require monthly updates.
How can I highlight trends and patterns effectively in my analytical report?
Highlighting trends and patterns in your analytical report is necessary. You can use data visualization tools like trend lines, heat maps, and time-series graphs. Highlight key changes with annotations to guide your audience toward the most important trends and insights.
How do I create reports that can be easily adapted for different formats (PDF, PowerPoint, etc.)?
Your analytical report should be adaptive to different formats. For that to happen, use tools like Power BI, Google Data Studio, or ViewMetrics that support exporting in different formats.
Work smarter by automating client reports now
Get Started for free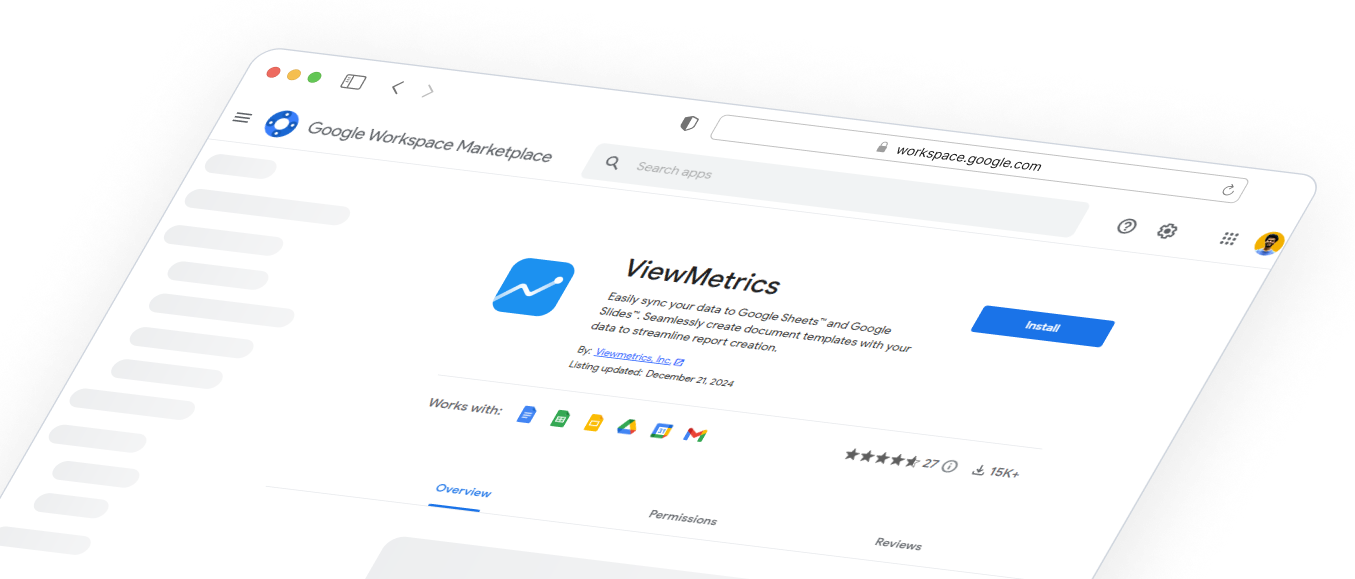
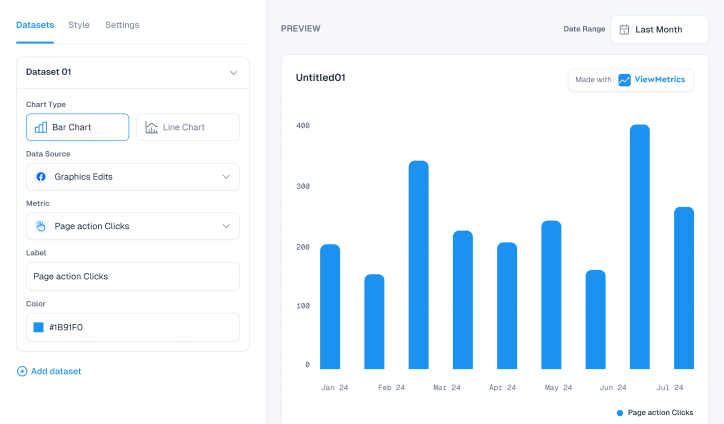
Design That Stands Out
Elevate visuals effortlessly with customizable styling options tailored to match brand aesthetics.
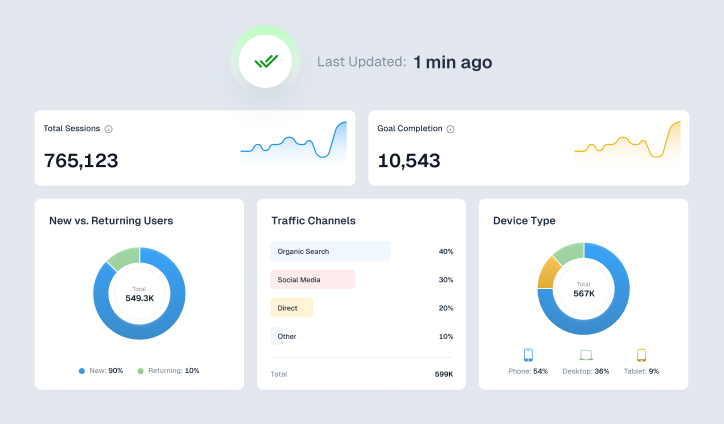
Effortless Data Syncing
Keep insights up-to-date with seamless and flexible data synchronization across platforms.
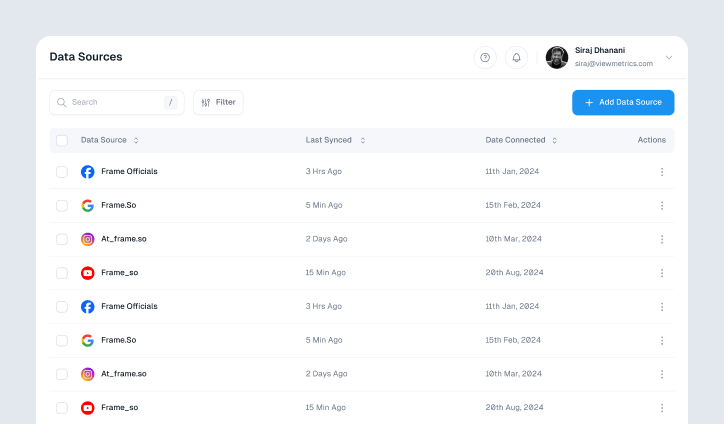
Connect with Ease
Integrate effortlessly with leading platforms to streamline workflows and maximize efficiency.
Boost Productivity with Google Add-On
Access powerful tools directly within Google Workspace for seamless marketing reporting.
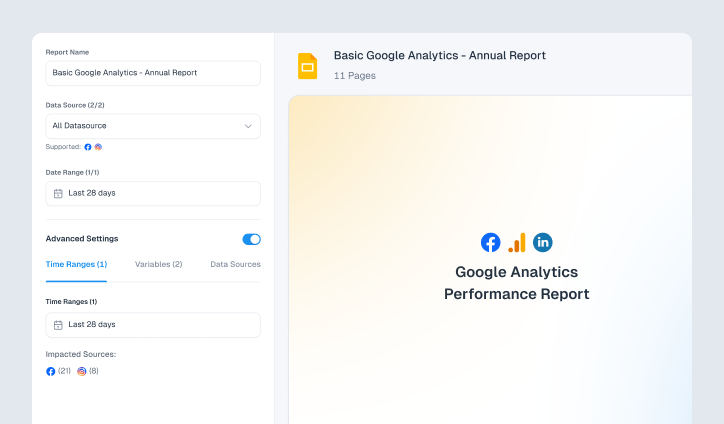
Custom Reports, Instant Insights
Generate tailored marketing reports effortlessly, delivering key insights in just a few clicks.
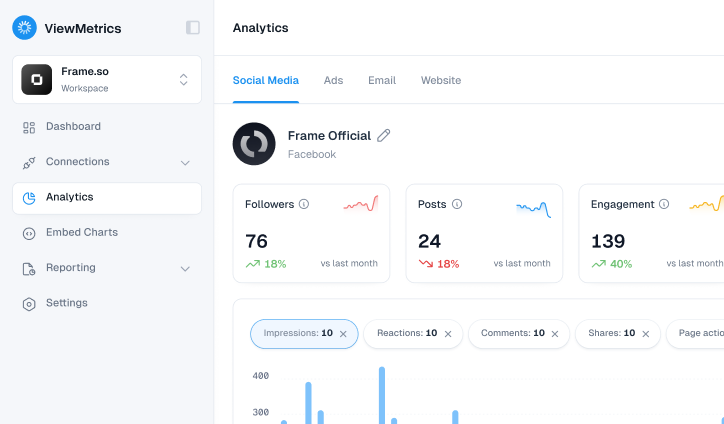
Actionable Analytics at a Glance
Access in-depth analytics to uncover trends, optimize strategies, and drive impactful decisions.
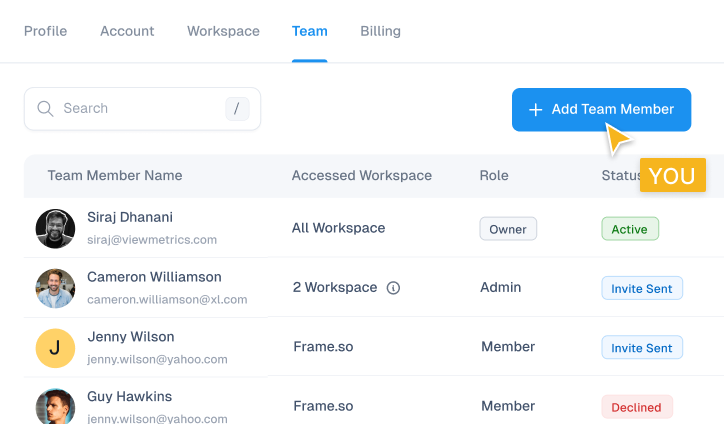
Collaborate with Ease
Invite team members to share insights, streamline workflows, and work together seamlessly.

Design That Stands Out
Elevate visuals effortlessly with customizable styling options tailored to match brand aesthetics.

Effortless Data Syncing
Keep insights up-to-date with seamless and flexible data synchronization across platforms.

Connect with Ease
Integrate effortlessly with leading platforms to streamline workflows and maximize efficiency.

Boost Productivity with Google Add-On
Access powerful tools directly within Google Workspace for seamless marketing reporting.

Custom Reports, Instant Insights
Generate tailored marketing reports effortlessly, delivering key insights in just a few clicks.

Actionable Analytics at a Glance
Access in-depth analytics to uncover trends, optimize strategies, and drive impactful decisions.

Collaborate with Ease
Invite team members to share insights, streamline workflows, and work together seamlessly.

Design That Stands Out
Elevate visuals effortlessly with customizable styling options tailored to match brand aesthetics.

Effortless Data Syncing
Keep insights up-to-date with seamless and flexible data synchronization across platforms.

Connect with Ease
Integrate effortlessly with leading platforms to streamline workflows and maximize efficiency.

Boost Productivity with Google Add-On
Access powerful tools directly within Google Workspace for seamless marketing reporting.

Custom Reports, Instant Insights
Generate tailored marketing reports effortlessly, delivering key insights in just a few clicks.

Actionable Analytics at a Glance
Access in-depth analytics to uncover trends, optimize strategies, and drive impactful decisions.

Collaborate with Ease
Invite team members to share insights, streamline workflows, and work together seamlessly.


