Understanding the difference between a parameter and a statistic might seem like a small detail, but it’s a crucial one for anyone serious about making data-driven decisions in marketing.
These terms aren’t just jargon, as they represent different ways of looking at the numbers that can guide your strategy. Grasping what each means, and when to use them, can be the difference between guessing and knowing what your next move should be.
This article will break down these concepts, so you can use them to make smarter, more informed decisions.
What is a Parameter?
A parameter refers to a measurable characteristic or attribute of an entire population. In marketing, the population typically refers to the total pool of customers, potential customers, or any other group relevant to the business’s operations. Parameters are constants, representing the true value for the entire population.
What are Examples of Parameters in Marketing?
Here are examples showing how parameters help you grasp the overall performance of your strategies:

- Conversion Rate: This parameter shows the percentage of visitors who take a desired action, like making a purchase or signing up for a newsletter. It’s a direct indicator of how well your marketing efforts are converting interest into action.
- Customer Acquisition Cost (CAC): Every business needs to know how much it costs to bring in a new customer. The CAC is that figure- a sum of all marketing and sales expenses spread across your entire customer acquisition efforts. It’s a hard, fixed number that reflects the efficiency of your marketing machine.
- Click-Through Rate (CTR): In the world of digital marketing, getting someone to click on your ad is a victory. The CTR measures this success, showing the ratio of clicks to total impressions. It’s a constant measure that helps you understand how compelling your ad content is, across the board.
What is a Statistic?
A statistic is a number that comes from a sample of your data. Unlike a parameter, it can change depending on which sample you look at. Statistics are practical tools for making sense of the broader trends in your data without needing to analyze the entire population.
What are Examples of Statistics in Marketing?
Here are three examples of statistics in marketing:

- Market Share: This tells you how much of the market your company controls compared to your competitors. It’s a solid indicator of your position in the industry.
- Return on Investment (ROI): ROI is where the rubber meets the road in marketing. It is a critical statistic that measures the profitability of a marketing campaign by dividing the net profit by the total cost, helping you assess the financial efficiency of your strategies.
- Customer Retention Rate: Keeping a customer is just as important as acquiring one. The retention rate statistic shows you how well you’re holding onto your customers over time. It’s a direct reflection of your customer loyalty efforts and an indicator of future revenue potential.
Tip: Use Ad hoc reporting which helps businesses by enabling quick, customized data analysis for real-time decision-making and performance monitoring.
Difference Between Parameter and Statistic
Usage in Marketing
- Parameters: In marketing, using parameters is ideal because they give a complete and accurate picture of the whole customer base. However, they are often impractical to use because gathering data from everyone takes a lot of time and money.
- Statistics: Statistics are used more frequently in marketing because they are faster and more cost-effective. Marketers rely on sample data to make quick decisions and understand how a campaign or strategy might perform for the larger population.
Here’s a quick ‘parameter vs. statistic’ to clarify the differences:
| Aspect | Parameter | Statistic |
| Definition | A number that represents something about an entire population. | A number that represents something about a sample of a population. |
| Example in Marketing | Conversion Rate (the percentage of visitors who become customers) | Return on Investment (ROI) |
| Purpose | Used to set benchmarks or goals for overall performance. | Used to analyze and interpret data to inform decisions. |
| Value | It’s a fixed value, consistent across the population. | It’s variable and changes depending on the sample. |
| Nature | Often theoretical, representing an ideal target. | Based on actual measured outcomes, reflecting real-world data. |
| Data Source | Comes from the entire population or full dataset. | Derived from a sample or subset of the data. |
How to Use Parameters and Statistics in Marketing Strategy?
Using Parameters for Long-Term Strategy
Parameters are most useful when making broad, long-term decisions because they reflect the true behavior of your entire customer base. By using parameters, marketers can:
- Create customer personas based on complete market data. These personas help you understand the needs, behaviors, and preferences of your entire audience, not just a small sample.
- Make strategic decisions about long-term customer retention and product development. For example, knowing the average lifetime value (LTV) of all customers can help you allocate budgets for loyalty programs or guide product innovation.
However, parameters are rarely practical to gather, as it takes time and resources to analyze the entire population. When possible, parameters offer the most accurate insights, but marketers often use statistics due to ease and cost.
Using Statistics for Campaign Testing
Statistics are the go-to tool for marketers when testing campaigns, products, or ideas on smaller groups. Instead of analyzing the entire customer base, marketers can:
- Run A/B tests to compare different versions of ads, emails, or landing pages on a sample of the target audience. These results help marketers determine which option will perform better overall.
- Test new product launches or collect customer feedback through surveys, using a subset of customers to gauge how the larger population might respond.
- Adjust marketing strategies based on the insights gained from these tests. Statistics help marketers quickly see what’s working, allowing them to optimize their efforts for the broader audience without investing in full-scale research.
Tip: Implement Quarterly Business Reviews (QBRs) to help businesses grow by aligning goals, identifying opportunities, and strengthening client relationships through data-driven insights.
Common Marketing Mistakes: Confusing Parameters with Statistics
It’s important to know the difference between parameters and statistics because they represent different scopes of data. Misinterpreting one for the other can lead to inaccurate conclusions and poor marketing decisions.
Why Knowing the Difference Matters
- Parameters represent the whole picture, so they provide a complete understanding of customer behavior. However, statistics represent a smaller sample, and assuming they speak for the entire population can lead to incorrect assumptions.
- Inaccurate Decision-Making: If marketers mistakenly treat a statistic as if it reflects the entire customer base (as a parameter would), they might overestimate or underestimate their campaign’s success, leading to the misallocation of resources or poorly designed strategies.
Real-World Example:
Let’s say a company runs an A/B test on 500 customers and finds that a new ad format increases conversions by 20%. This result is a statistic — it reflects only that small group. If the company treats this statistic as if it’s a parameter and assumes the entire customer base will react the same way, they may roll out the ad to everyone, only to discover it doesn’t perform as well on the larger audience. The mistake lies in assuming that the behavior of a small sample applies to the whole population.
By understanding the difference between parameters and statistics, marketers can avoid this pitfall and make data-driven decisions that are more likely to yield accurate and positive results.
Conclusion
At the end of the day, the real power in marketing comes from knowing not just what your data is, but what it can do for you. Parameters provide the stable benchmarks that guide your overall strategy, while statistics offer the flexibility to adapt and polish your approach as you go.
When you understand how to balance these two, you’re not just playing the game- you’re shaping it. With tools like ViewMetrics, you can turn every piece of data into a stepping stone toward greater success, making your marketing smarter, more efficient, and more effective.
Work smarter by automating client reports now
Get Started for free
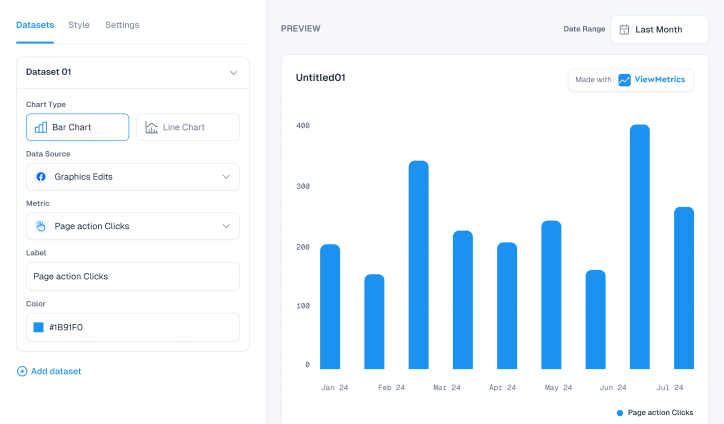
Design That Stands Out
Elevate visuals effortlessly with customizable styling options tailored to match brand aesthetics.
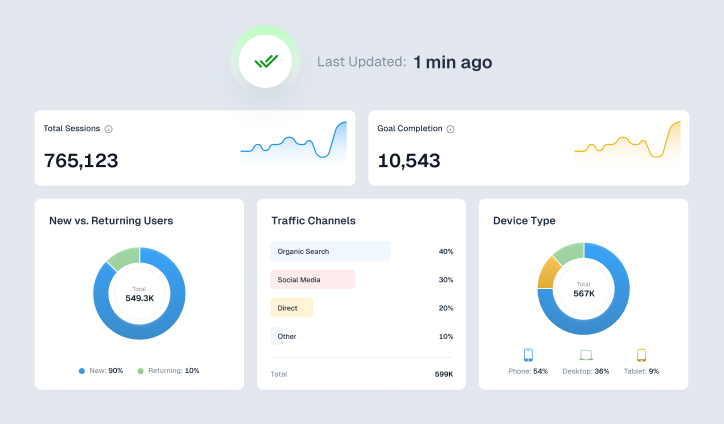
Effortless Data Syncing
Keep insights up-to-date with seamless and flexible data synchronization across platforms.
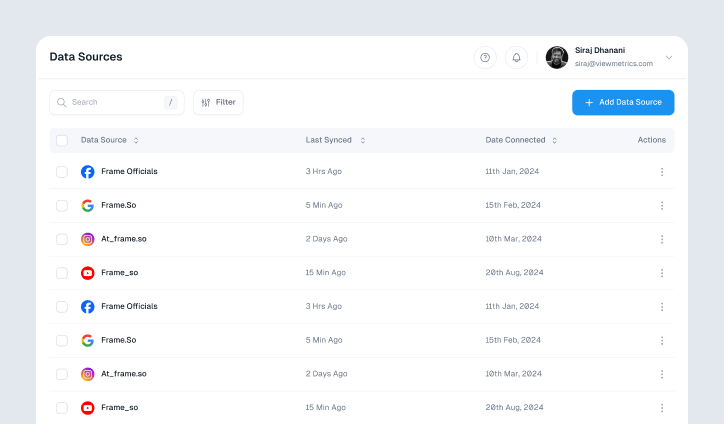
Connect with Ease
Integrate effortlessly with leading platforms to streamline workflows and maximize efficiency.
Boost Productivity with Google Add-On
Access powerful tools directly within Google Workspace for seamless marketing reporting.
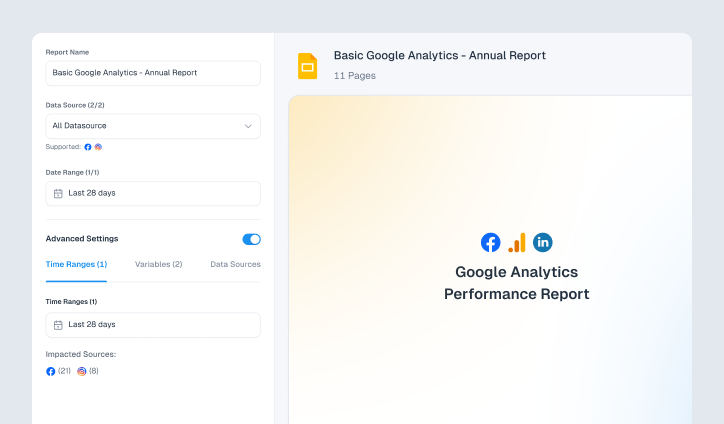
Custom Reports, Instant Insights
Generate tailored marketing reports effortlessly, delivering key insights in just a few clicks.
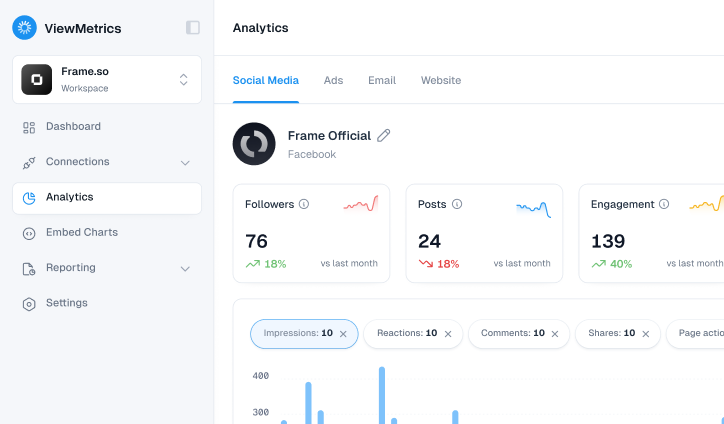
Actionable Analytics at a Glance
Access in-depth analytics to uncover trends, optimize strategies, and drive impactful decisions.

Collaborate with Ease
Invite team members to share insights, streamline workflows, and work together seamlessly.

Design That Stands Out
Elevate visuals effortlessly with customizable styling options tailored to match brand aesthetics.

Effortless Data Syncing
Keep insights up-to-date with seamless and flexible data synchronization across platforms.

Connect with Ease
Integrate effortlessly with leading platforms to streamline workflows and maximize efficiency.

Boost Productivity with Google Add-On
Access powerful tools directly within Google Workspace for seamless marketing reporting.

Custom Reports, Instant Insights
Generate tailored marketing reports effortlessly, delivering key insights in just a few clicks.

Actionable Analytics at a Glance
Access in-depth analytics to uncover trends, optimize strategies, and drive impactful decisions.

Collaborate with Ease
Invite team members to share insights, streamline workflows, and work together seamlessly.

Design That Stands Out
Elevate visuals effortlessly with customizable styling options tailored to match brand aesthetics.

Effortless Data Syncing
Keep insights up-to-date with seamless and flexible data synchronization across platforms.

Connect with Ease
Integrate effortlessly with leading platforms to streamline workflows and maximize efficiency.

Boost Productivity with Google Add-On
Access powerful tools directly within Google Workspace for seamless marketing reporting.

Custom Reports, Instant Insights
Generate tailored marketing reports effortlessly, delivering key insights in just a few clicks.

Actionable Analytics at a Glance
Access in-depth analytics to uncover trends, optimize strategies, and drive impactful decisions.

Collaborate with Ease
Invite team members to share insights, streamline workflows, and work together seamlessly.

