Summary for the Blog
- What are Social Media KPIs? Social Media KPIs are measurable metrics used to evaluate the success of your social media strategy across platforms like Instagram, Twitter, and LinkedIn.
- Why do they matter? Tracking KPIs helps you identify what’s working, refine your approach, and ensure your content aligns with business goals.
- Which KPIs should you track? Focus on metrics like engagement rate, reach, impressions, follower growth, and conversions to assess both awareness and performance.
- How to choose the right KPIs? Align your KPIs with your campaign objectives—brand awareness, engagement, traffic, or sales—to get meaningful insights.
There’s no doubt that today, every business needs to be on social media to connect better with their audience and create great brand visibility. Let’s assume you are investing ample time and money in social media marketing. But is it even giving you any results?
How do you know that your social media campaigns are delivering positive results? Are they even reaching the right audience? Or are you simply aiming in the dark?
This is why understanding the necessary social media KPIs is important.
What are Social Media KPIs?
Social Media KPIs (Key Performance Indicators) play a crucial role for digital marketers and social media strategists in evaluating how well your social media campaigns are doing.
When it comes to social media marketing, it’s not just a one-size-fits-all approach. Social media teams are busy engaging with audiences on various platforms like Facebook, Twitter, LinkedIn, Instagram, and Pinterest to distribute their content. This multi-channel strategy can complicate measuring campaign success, as the results are scattered across different accounts.
To truly optimize your marketing efforts, gaining insight into your social media performance is essential. That means diligently tracking your metrics and KPIs using a dedicated social media dashboard. This way, you can ensure your strategies are effective and fine-tune them for better results. Learn more about what is KPI dashboard.
Social Media KPIs to Track
Social media KPIs can be known as the building blocks of any social media campaign. But how do you know exactly which ones you should be tracking to learn the behavior of your customers and improve when and where needed? We have divided these KPIs into four main categories to help you track them efficiently:
Reach KPIs

Reach KPIs gauge the number of users who encounter your social media channels. You can think of reach as a metric that quantifies your audience. It reveals not just the size of your current and potential viewers but also shows how your audience grows over time and reflects your brand’s visibility.
Essentially, the reach data is a powerful tool for understanding how well your brand is resonating with the public! Learn the difference between reach vs impressions.
1. Impressions
It represents how often your post has appeared in someone’s feed or timeline. Remember, though, that this doesn’t guarantee the viewer actually noticed or engaged with the content; it simply means your post made it onto their screen.
2. Post Reach
This indicates the number of people who view a post. Reach can fluctuate depending on factors such as when your audience is most active online and the quality of your content. It provides insights into what your audience finds engaging and valuable. Read more about what is reach in marketing.
3. Follower Count
It refers to the total number of users who have opted to follow your social media profile. This number encompasses both individual users and brands alike.
4. Follower Growth Rate
It’s important to focus on gaining followers rather than losing them. The audience growth rate indicates how your follower count evolves. To calculate this metric, simply divide the number of new followers gained by your total follower count.
5. Unique Visitors
This is a key performance indicator that tracks the number of distinct users who visit a social media page or account within a specific timeframe. Unlike page views, which can count multiple visits by the same user, unique visitors only tally each individual once, no matter how many times they return.
6. Viral Reach
This social media KPI quantifies how many people have seen a post through shares and reposts by other users rather than through paid ads or organic reach. This metric is crucial for gauging the viral potential of a piece of content, as it highlights the audience reached beyond your account’s current followers.
7. Video Views
Video views indicate how often users have watched your video content on social media. Each platform has its own criteria for counting a view. For example, Facebook counts a view after a user watches the video for at least three seconds, while YouTube requires a minimum of 30 seconds of viewing time to register a count.
Engagement KPIs

Engagement metrics assess how users interact with your social media content. These metrics reflect your audience’s level of involvement with your brand, providing insight into how much they appreciate your posts.
Here are some common social media KPIs that showcase engagement:
8. Reactions
Reactions represent a fundamental form of engagement. Users can express their feelings by clicking buttons like “Like,” “Love,” or “Celebrate.” These reactions offer an easy way for users to engage with your content and share their sentiments.
9. Comments
Comments are written responses that users add to your social media content. These can be directed at the original post or as replies to other comments. Users might also tag your account or others in their comments, encouraging a more interactive and engaging discussion around your content.
10. Shares
Shares are considered in the engagement KPIs as they showcase when social media users repost your content on their own page. They might share it just as it is or add a thought to your content.
11. Saves
Saves occur when users bookmark your post for later viewing. They demonstrate that users consider your content valuable enough to return to, which strongly indicates interest and engagement.
12. Average Engagement Rate
Your average engagement rate can be expressed in several ways, but it’s commonly calculated as the percentage of followers interacting with your content. To determine your average engagement rate, divide the total number of engagements (likes, comments, shares, etc.) your posts received by the total number of posts within a specific timeframe.
Conversion KPIs

Conversion metrics assess how well your content motivates users to take specific actions, such as making a purchase or filling out a form.
Here are some common social media KPIs that focus on conversions:
13. Click-Through Rate (CTR)
It measures the percentage of individuals who clicked a link in your social media post compared to the total number of viewers of that post. To calculate CTR, divide the number of clicks your post received by the total impressions (views), then multiply the result by 100 to express it as a percentage.
14. Conversion Rate
The conversion rate represents the percentage of users who take your desired action after engaging with your social media post or ad. To calculate the conversion rate, divide the number of conversions (users who completed the action) by the total number of users who clicked on your post or ad, then multiply the result by 100 to express it as a percentage.
15. Cost Per Click (CPC) or Cost Per Conversion
It refers to the fee you pay to an advertising platform each time someone clicks on your ad. This metric is particularly relevant if you’re running paid social ads, as there are no advertising costs associated with organic posts. To calculate CPC, divide your total ad expenditure by the number of clicks your ad received.
16. Sales Revenue
Sales revenue from social media represents the total income generated from your social media marketing efforts. This figure is determined by tracking the sales directly linked to your social media channels.
17. Bounce Rate
It is the percentage of visitors who clicked on a link in your social post but left that page without taking any further action. A low bounce rate is desirable, as it indicates that the user experience did not meet expectations.
18. Cost Per Thousand Impressions (CPM)
This represents the amount you pay for every 1,000 people who see your social media ad. Since it focuses on raising awareness rather than driving conversions, keeping costs relatively low is important. Understanding your sales funnel is essential, as it helps you connect the value of exposure to tangible business growth.
Brand KPIs

Here are a few brand KPIs to look out for:
19. Brand Mentions
They refer to instances when users talk about your brand on social media. This can occur through tagging your account or mentioning your brand in a post or comment.
20. Branded and Campaign Hashtags
Branded hashtags are specific to your company, often featuring your brand name or slogan. While campaign hashtags are designed for particular marketing initiatives. Both branded and campaign hashtags enhance your visibility on social media.
21. Share of Voice
Share of voice indicates how well-known your brand is compared to your competitors. It’s essentially a way to gauge your portion of the overall conversation within your niche.
KPIs Specific to Each Social Media Platform
KPIs are important to track, and now you know why. But they vary for each platform.
1. Facebook KPIs
Facebook metrics enable you to track and analyze changes, helping you make informed decisions for running successful campaigns or growing your online business.
However, a metric is only valuable if you understand how to use it and why it matters. Facebook provides a solid default setup of pre-made metrics, but you also have the option to customize them to fit your specific needs.
Here are some of the most important Facebook metrics to track for your next social media campaign, both paid and organic:
- Engagement
- Reach
- Impressions
- Video Average Watch Time
- Frequency
- Click-Through Rate
- CPM (Cost Per 1,000 Impressions)
- Cost Per Click
- CPA (Cost Per Action)
- Engagement Rate
- Conversion Rate
- Page Likes and Followers
- Follower Demographics
- Referral Traffic From Facebook
- Share of Voice
Read More about Facebook KPIs here.
2. Instagram KPIs
Like Facebook, you must also keep tabs on your Instagram KPIs to analyze your Instagram’s marketing strategy. Here are some key KPIs to look for when analyzing:
- Profile visits
- Website clicks
- Audience demographics
- Total followers and overall follower growth rate
- Post reach
- Post shares
- Post comments
- Top posts
- Instagram engagement rate
- Ad clicks
- Ad reach
- Cost per click or cost per conversion
- Ad engagement rate
- Conversions and conversion rate
- Instagram Reels metrics
- Instagram Stories metrics
- Most engaged hashtags
- Profile interactions
Read more about Instagram KPIs here.
3. LinkedIn KPIs
Every B2B company, regardless of size, should incorporate LinkedIn performance indicators into its overall marketing strategy. As a platform geared toward business professionals, LinkedIn provides a unique opportunity for marketers to connect with high-level executives easily.
Establishing a strong LinkedIn marketing plan and setting the right KPIs is one of the most strategic moves a B2B brand can make.
Here are some key KPIs you should track if you are running a marketing strategy for LinkedIn:
- Follower growth rate
- Number of post views
- Engagement rate
- Video views
- Impressions and reach
- Click-through rate
- Followers demographics
- Conversion rate
- Cost per conversion
- LinkedIn page/profile views
Read more about LinkedIn KPIs here.
4. Twitter KPIs
Twitter KPIs are metrics used to evaluate the performance of a Twitter account, including tweet reach, engagement, and overall account health. These KPIs are essential for businesses to measure the success of their Twitter campaigns. You can fine-tune your Twitter strategies to better connect with your target audience and achieve marketing goals by tracking them.
Here are some key Twitter KPIs you should be looking out for:
- Number of followers
- Number of mentions
- Number of retweets
- Number of likes
- Link clicks
- Profile clicks
- Click-through rate (CTR)
- Twitter engagement rate
- Twitter reach
- Twitter impressions
- Hashtag performance
- Cost Per Results (CPR)
- Cost Per Mille (CPM)
Read more about Twitter KPIs here.
How Does ViewMetrics Help You Track Social Media KPIs?
As you now know, tracking your social media KPIs is important in analyzing your marketing campaigns. You must understand what is working and not working in your favor for a successful campaign. And measuring these KPIs on different social media platforms is the key to successfully understanding your audience. But tracking different social media KPIs on different platforms can be tiresome. Here’s when ViewMetrics comes into play!
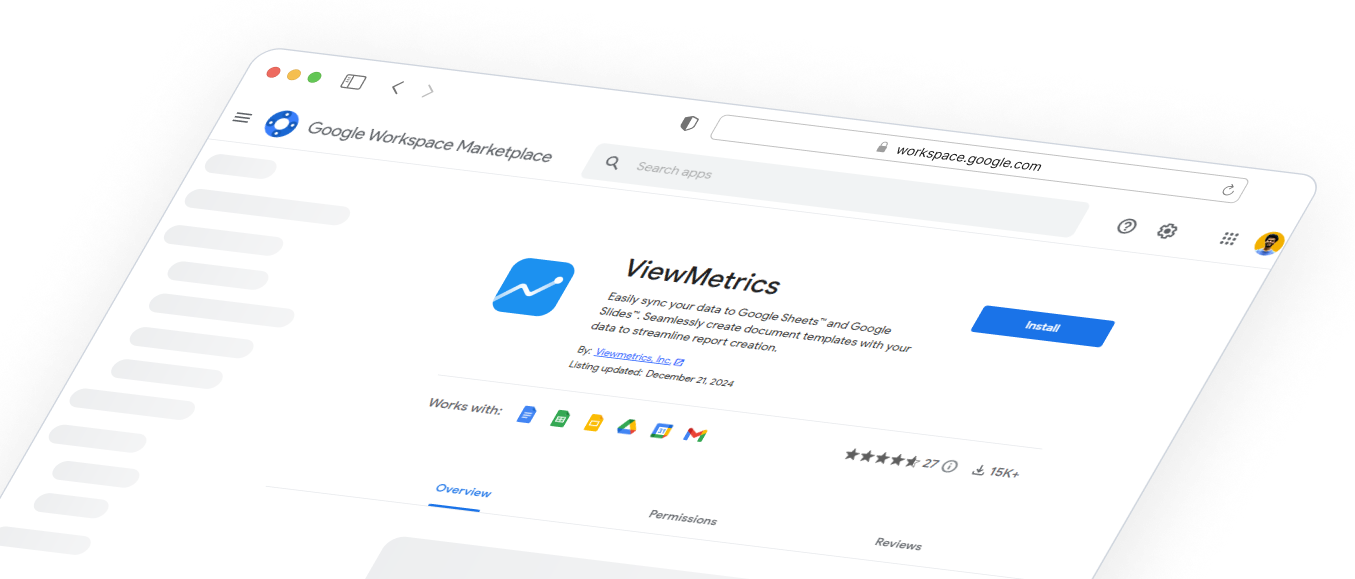
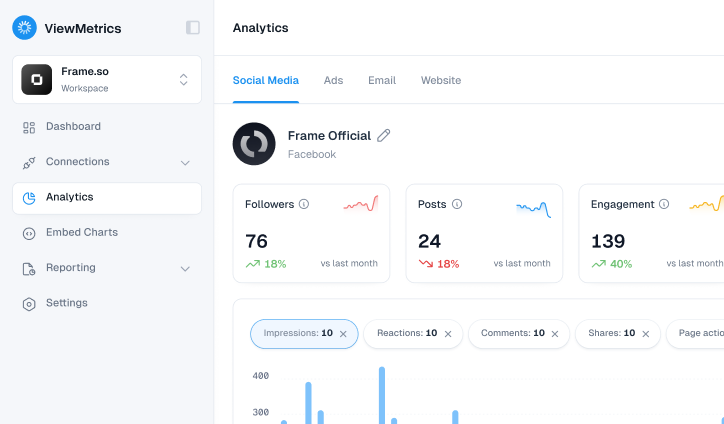
ViewMetrics provides a comprehensive solution for tracking key social media KPIs by integrating with platforms like Facebook, Instagram, Twitter, LinkedIn, YouTube, and Facebook Ads. Its advanced analytics capabilities allow you to monitor critical performance metrics easily.
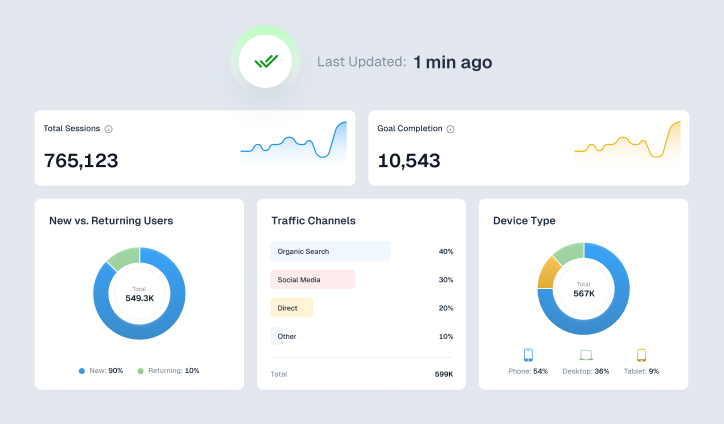
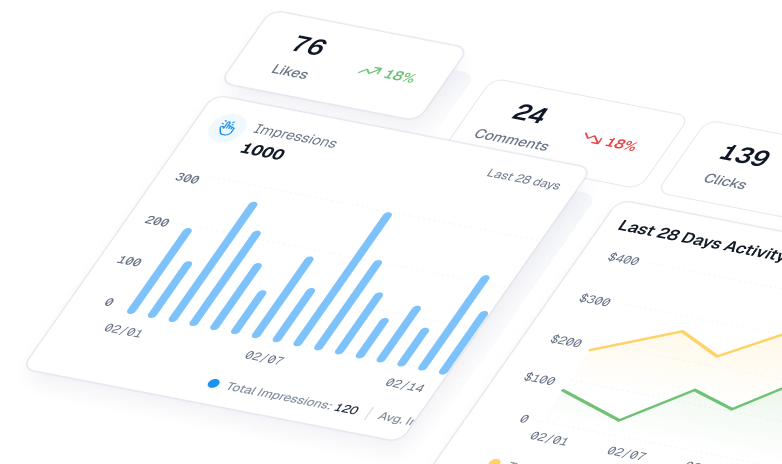
By consolidating data from these platforms into a single dashboard, ViewMetrics makes it simpler to identify your top-performing content, see where your audience is most engaged, and understand how your social media strategy contributes to business results.
View All Your Marketing and Website Data - Instantly
Connect Instagram, Mailchimp, Google Analytics & more
Pre-built dashboards, no setup needed
Save hours on reporting every week
Frequently Asked Questions
What is the 80/20 rule in social media marketing?
The 80/20 is a powerful social media marketing rule that follows the concept of 80% educational and informational content while 20% promotional content. It is believed that for your brand to perform well on social media and connect with your audience 80% of the time, you should create valuable, problem-solving, entertaining, and educational content, while the remaining 20% of the time, you should post promotional content.
How do you benchmark social media performance?
Social media benchmarking involves taking a close look at key metrics like post frequency, follower growth, response times, and engagement levels, then comparing those numbers against your competitors. It’s all about understanding where you stand in the social media landscape and spotting areas where you can improve or learn from what others are doing.
How do I choose a social media KPI?
When choosing the best social media KPIs to track, keep in mind that you should align them with your business goals. For instance, you might want to track social media metrics based on objectives such as driving sales, expanding your customer base, or increasing your follower count.
What is a good social media engagement rate?
An engagement rate between 1% and 3.5% is considered average, while anything above 3.5% is seen as strong. This figure in your social media analytics indicates how well your audience resonates with the content you’re sharing.


