Summary for the Blog
- Data Blending: The process of combining data from various sources into a single, unified dataset for on-the-spot visualization and analysis.
- When to Use It: It’s ideal for ad hoc reports, financial decision-making, and trend analysis, especially when data is spread across multiple platforms like spreadsheets, cloud services, and web apps.
- Methods: The article outlines three primary methods: joining and uniting, stacking and appending, and grouping and aggregation.
- Limitations: Challenges include mismatches in data granularity, unsupported aggregations, issues with null values, and difficulties with very large datasets.
Businesses have to deal with crucial data sets coming from multiple sources. This makes functioning difficult. That’s when data blending helps.
What is Data Blending?
Data blending consists of the process of pulling data from different sources to create a unique and single dataset that can be visually presented on a dashboard or through other visualizations for processing and analyzing.
To put it simply, as an organization, you may have your data spread across different platforms like Sheets or Excel, cloud systems, IoT devices, and web applications.
With the help of a data blending platform, you can extract data from these different sources and then quickly mash it together. The main purpose of data blending is for quicker data analysis and ad hoc reporting.
Primary vs. Secondary Data Sources in Data Blending
For data blending, you need to have a primary and secondary data source. Now, what are these data sources?
The primary data source is the original source from where you will extract your information. This includes raw data. While the secondary data source is the data that you pull from the primary sources. This data is then used for analysis and research.
Note that secondary data sources exist and operate solely through primary data sources. Both of these data sources can be used to separate data without altering or losing it in the blending process.
Data Blending vs. Data Integration
The main goal of both data blending and data integration is to pull data from different sources and combine it for analysis. However, the main difference is that data blending is a combining process that takes place on the spot. It is used when multiple source data need to be used for a use case in a specific timeframe.
On the contrary, the data integration process takes a longer time. There are several steps to follow before data is blended into one place for use. The processes included here are data refinement, cleansing, virtualization, and deduplication.
Data Blending vs. Data Joining
When analysts join data, they combine two data sets of the same format—like two SQL databases—and align them side by side. This process requires at least one matching column between the two sets. However, blending data works differently and doesn’t rely on identical columns.
While joining is great for quick comparisons between two data sets, it has its limitations. You’re restricted to just two sources at a time, and things get tricky with larger data sets or certain databases that don’t support joins.
On the other hand, data blending offers more flexibility, especially when you need to clean or tweak the data—like filling in missing values or fixing errors—before pulling everything together.
View All Your Marketing and Website Data - Instantly
Connect Instagram, Mailchimp, Google Analytics & more
Pre-built dashboards, no setup needed
Save hours on reporting every week
When to Implement Data Blending in Your Business?
Data blending comes with multiple benefits for your business. But when should you exactly get involved in this practice? Here are some main scenarios to help you answer your question about when to implement data blending in your business:

1. Multiple Data Sources
It happens so that your business may be collecting data from different platforms that aren’t naturally integrated (e.g., CRM, web analytics, ERP). If this is the case, then data blending can help in quickly combining data from multiple sources and give you a holistic view of customer interactions and your operations.
2. Ad Hoc Reports
Ad hoc reports are meant for making quick business decisions, and if your business needs to make such reports frequently, data blending can help you by creating customized reports.
These reports do not rely on IT support or pre-built data pipelines. Data blending is flexible and perfect for business teams that need reports on the go with data that rapidly keeps changing.
3. Financial Decision-Making
Making crucial financial decisions in a business is all about extracting different data from expenses, sales, and operational costs. For this, you can use data blending by merging together information from different teams and gaining a comprehensive view of the total finances. So, data blending is crucial when forecasting revenue, preparing budgets, and evaluating investment options.
4. Trend Analysis
Data blending can help you combine and analyze information needed from different categories, such as product lines, regions, and customer segments, to compare performance.
This blend helps you analyze the recent trends seen in your business. For example, if you blend your sales data, you can track any trends seen and then work on your sales strategies accordingly.
Also Read: Best Digital Analytics Tools For Marketing
Choose the Right Data Blending Tools
With so many data blending tools in the market, picking the right one can feel overwhelming. Each platform offers its own unique strengths, so it’s all about finding the one that fits your needs like a glove. Some of the top players in the field include Tableau, Power BI, Domo, Qlik, and Zoho Data Prep, which stands out for its ability to simplify data blending.
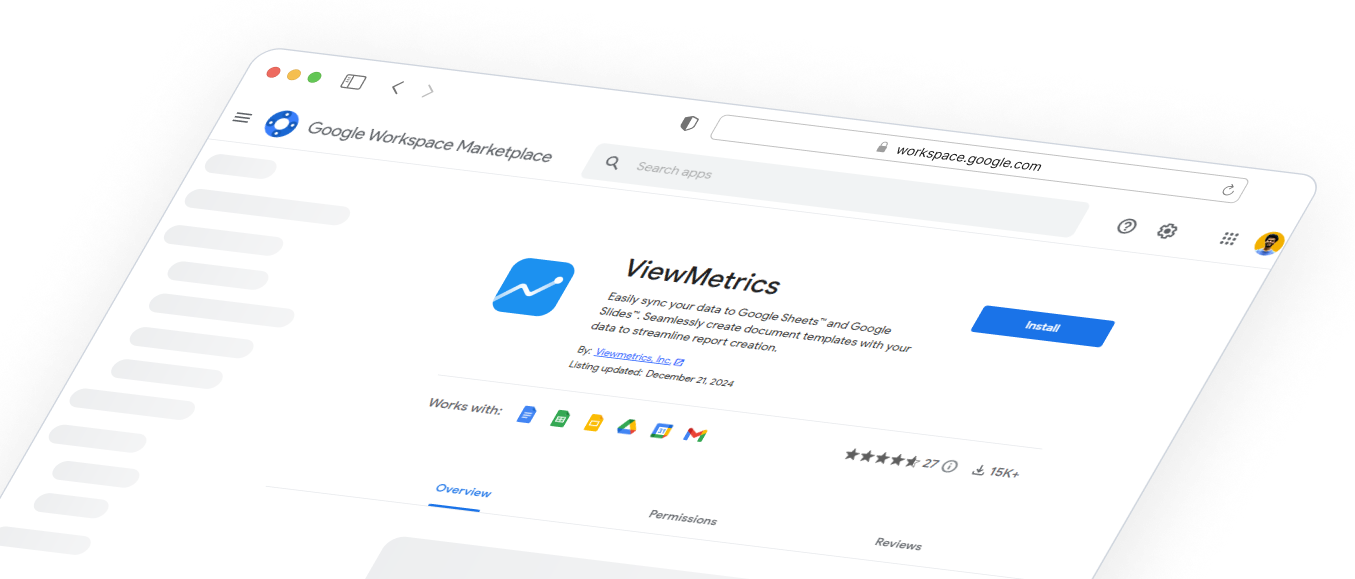
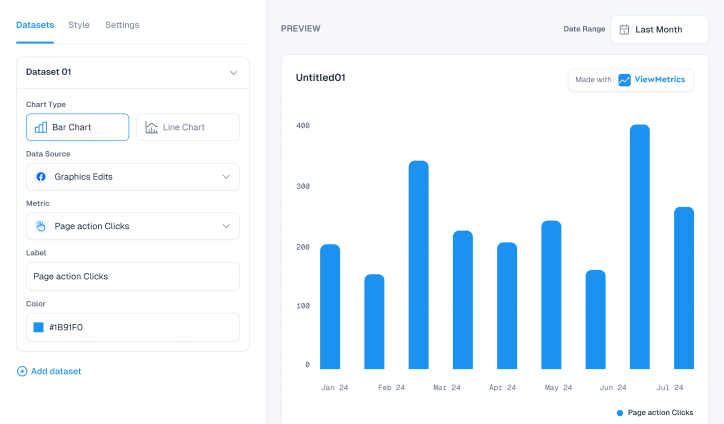
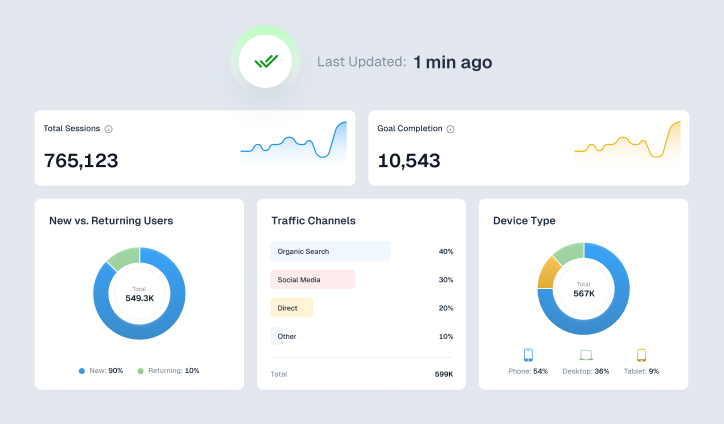
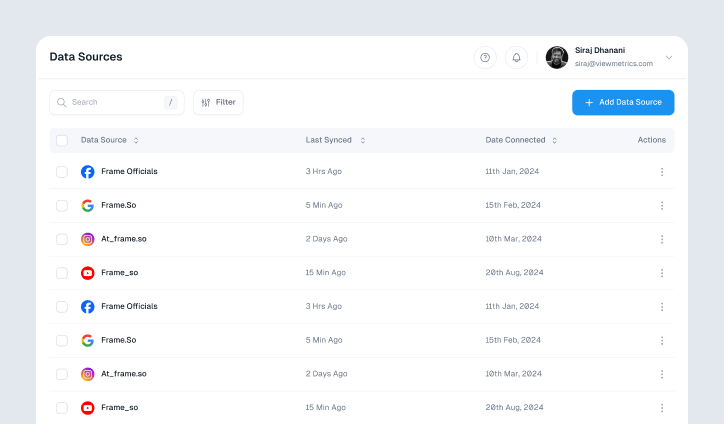
Speaking of data blending, tools like Viewmetrics come in handy here, especially if you’re juggling multiple marketing accounts. While it’s branded as a marketing analytics tool, Viewmetrics offers powerful data aggregation and visualization features that can easily be repurposed for a broader range of data analysis.
What are the Different Data Blending Methods?
Data blending can be done using three methods. Which method to pick depends on your goals, tools, and data sets. Below are the three different data blending methods:

Method 1: Joining and Uniting
The first method is to join and unite. Here’s how you can follow it through:
- Joins – Merge rows from different tables by matching specific criteria. The most common types are inner join, left join, right join, and full outer join. Below is some detail on the same:
- Left Join – A left join pulls in all rows from the first (left) dataset, along with any matching rows from the second (right) one.
- Right Join – A right join does the opposite of a left join. It grabs all rows from the right dataset and only the matching ones from the left.
- Inner Join – Brings together only the matching records from two datasets, keeping rows where the key values align in both.
- Outer Join – Keeps all records from both datasets, filling in missing values with nulls or defaults with no matches.
- Uniting- This method unites rows of one dataset to another and creates a new dataset that combines the different datasets. Uniting is useful when adding more data over time.
Method 2: Stacking and Appending
Another method is data stacking and appending. Here’s how they are useful:
- Stacking – Stacks datasets on top of each other, merging rows to form a longer dataset with matching columns.
- Appending – Joins datasets side by side, adding columns from one to another to build a more complete dataset.
Method 3: Grouping and Aggregation
The method of grouping and aggregation groups data by specific attributes and calculates aggregates like sums, averages, or counts for each group.
Limitations of Data Blending
Data blending isn’t without its challenges. While these hurdles are manageable, recognizing and addressing them is crucial.
1. Data Granularity Mismatch
When your data comes from various sources with different levels of detail—like some providing daily figures while others offer monthly summaries—it can throw off your results and might even demand complicated adjustments.
To truly gain valuable insights, it’s essential to blend your data at the right level of granularity.
2. Unsupported Aggregations
Certain aggregate functions, such as MEDIAN, COUNTD, and SUM, may not be available when blending data. This limitation can hinder the types of calculations you can carry out, ultimately constraining the depth of your analysis.
3. Null Values
Null values in any data source can disrupt the blending process and result in surprising outcomes. To maintain data integrity, it’s essential to manage these null values carefully and prevent inconsistencies from arising.
4. Data Volume
Working with massive datasets can sometimes cause performance hiccups or errors, especially when using data visualization tools or databases. The process of blending large datasets can put a strain on performance because of the heightened computational demands, and intricate calculations or aggregations can further slow things down.
To manage large datasets effectively, it might be necessary to resort to data sampling or aggregation techniques.
5. Data Source Compatibility
Not every data source blends smoothly together. Compatibility challenges can emerge from differing data formats, structures, or schemas. To achieve a successful blend, you may need to prepare and transform the data beforehand.
6. Join Type Limitations
Most data blending tools primarily support inner joins, which can restrict your flexibility in merging data. In some analysis situations, you may need to use outer joins or other types of joins to get the insights you’re looking for.
View All Your Marketing and Website Data - Instantly
Connect Instagram, Mailchimp, Google Analytics & more
Pre-built dashboards, no setup needed
Save hours on reporting every week
Conclusion
Streamlining your data blending process is necessary for the smooth functioning of a business. There are several data blending tools you can use to make this process hassle-free. We hope this comprehensive guide helps you and makes your data blending process effortless!
Frequently Asked Questions About Data Blending
1. What are the benefits of data blending?
The benefits of data blending include gaining deeper insights, making better-informed decisions, analyzing real-time data from multiple sources, and enjoying greater flexibility in data analysis.
2. How can data blending enhance data visualization?
Data blending allows for richer visualizations by integrating data from various sources, helping to reveal trends and insights that might not be apparent when examining data in isolation.
3. Can data blending be automated?
Yes, data blending can be automated using various analytics tools. ViewMetrics is particularly effective for managing multiple marketing accounts, as it offers powerful data aggregation and visualization features.
4. How does data blending differ from data integration?
Data blending typically happens on the fly in a BI or analytics tool by combining data from different sources just for analysis, whereas data integration is a more permanent process of consolidating data (via ETL or ELT) into a unified warehouse or system.
5. When should I use JOIN vs UNION for blending?
Use JOIN when you want to merge two datasets side-by-side using a common key (matching columns), and choose UNION when you need to stack datasets one on top of another (same schema) to append rows.
6. What challenges can you face when blending data?
Some common challenges include: mismatched data granularity (different aggregation levels), null or missing values, large data volume that slows performance, limited join types in tools, and compatibility issues between data sources.
7. Which tools support data blending?
Data blending is supported by analytics and BI platforms like Looker Studio, Tableau, Qlik Sense, and Alteryx, as well as workflow tools such as KNIME. ViewMetrics also enables smooth data blending by helping teams combine multi-source marketing and performance data for unified reporting.


