LinkedIn Analytics Dashboard Report Template | ViewMetrics
Get powerful insights with our LinkedIn Analytics Dashboard Report Template. Streamline your data analysis and elevate your professional presence!
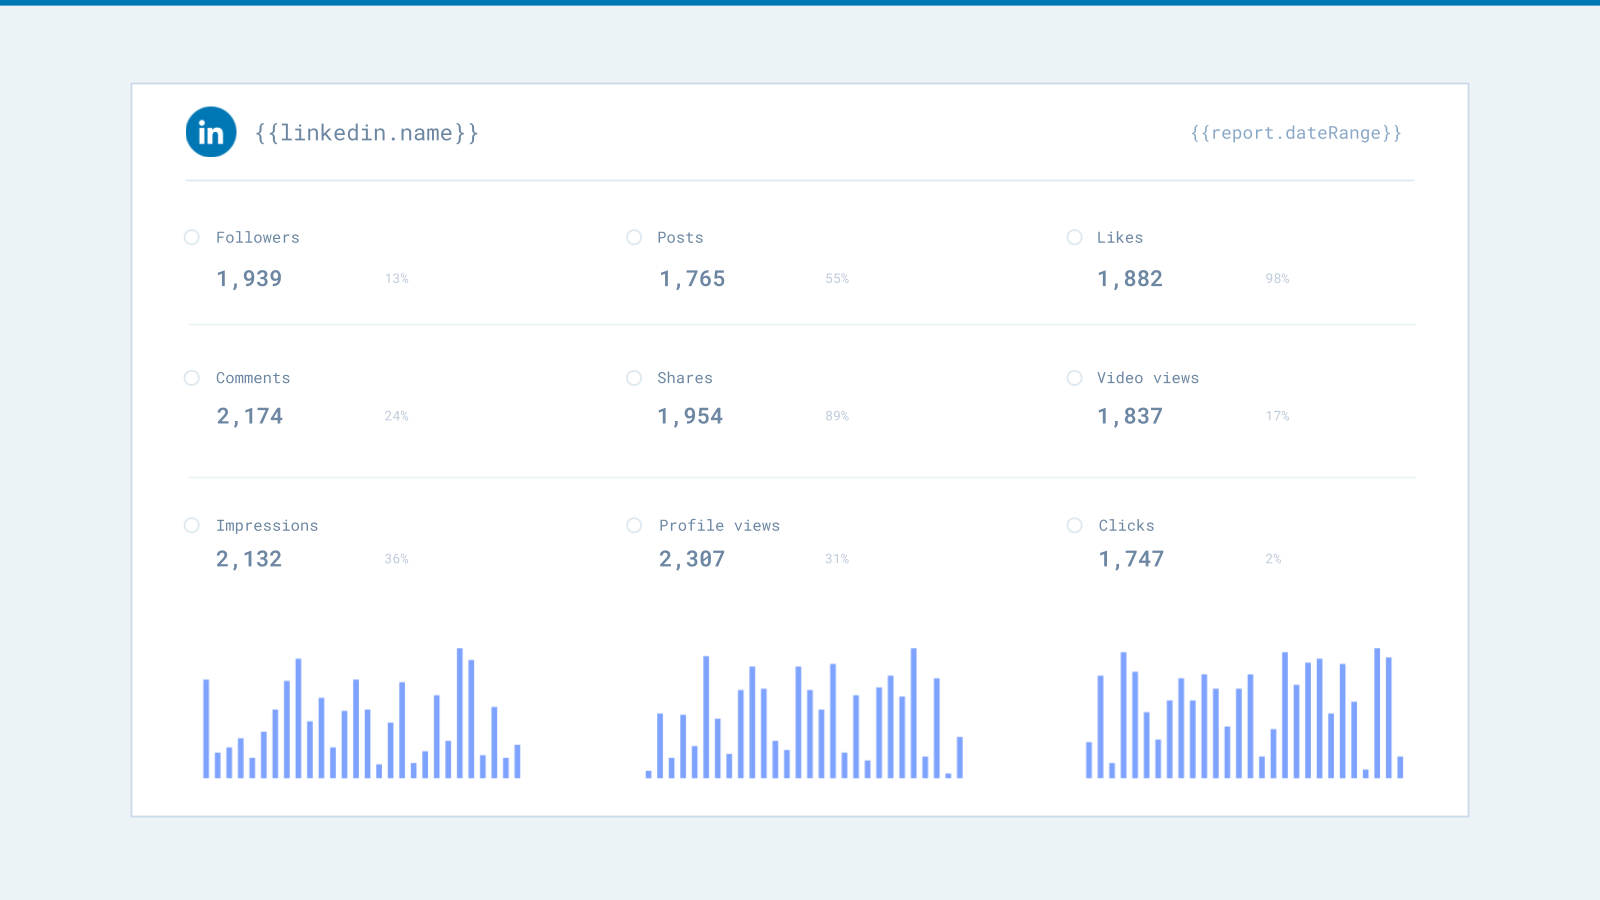


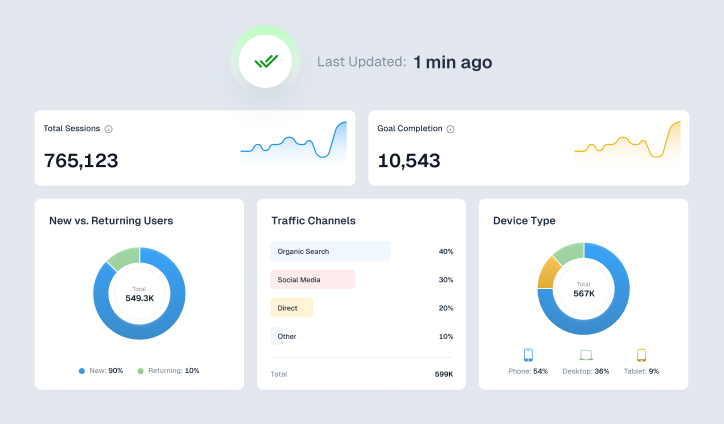
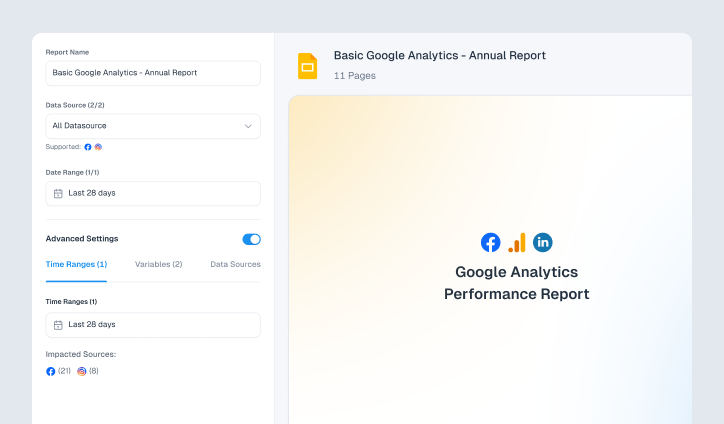
This LinkedIn single-slide dashboard view gives you a high-level overview of how your LinkedIn account is performing. you can refresh the data in the dashboard daily if you generate the report as a Google Slides presentation and configure a refresh schedule via our Google add-on.
Related Informational Resources:
FAQs Related to LinkedIn Analytics Dashboard Template
What are some common mistakes to avoid when using a LinkedIn Analytics Dashboard Template?
Overlooking Key Metrics: Focusing solely on vanity metrics (like follower count) while neglecting crucial KPIs like website clicks or conversion rates.
- Data Inaccuracy: Using outdated or incorrect data, leads to flawed conclusions.
- Ignoring Context: Analyzing data in isolation without considering external factors (e.g., industry trends, competitor activity).
- Lack of Actionable Insights: Creating a dashboard but failing to use the data to improve your LinkedIn strategy.
How can a LinkedIn Analytics Dashboard Template improve my LinkedIn marketing?
By providing data-driven insights to optimize campaigns, identify areas for improvement, and increase ROI.
Can I customize a LinkedIn Analytics Dashboard Template?
Yes, most templates are customizable to fit your specific needs and branding.
What metrics should a LinkedIn Analytics Dashboard Template include?
Reach, impressions, engagement, website clicks, conversion rates, cost-per-click (CPC), cost-per-thousand-impressions (CPM), etc.


Frequently asked questions
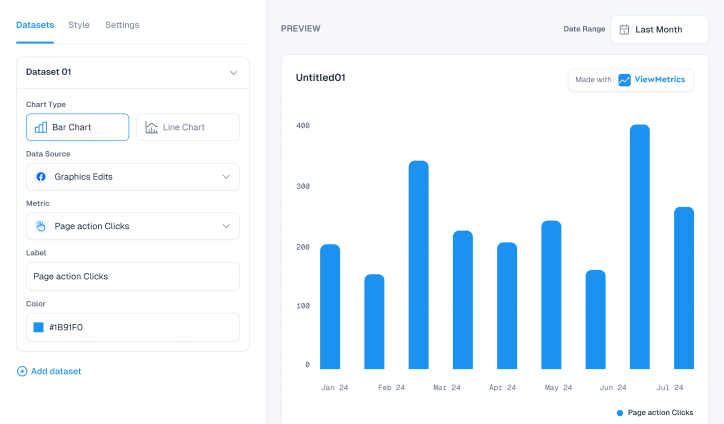
Save time by auto-inserting metrics, charts, and screenshots into templates.
Get Started for Free
Design That Stands Out
Elevate visuals effortlessly with customizable styling options tailored to match brand aesthetics.
Effortless Data Syncing
Keep insights up-to-date with seamless and flexible data synchronization across platforms.
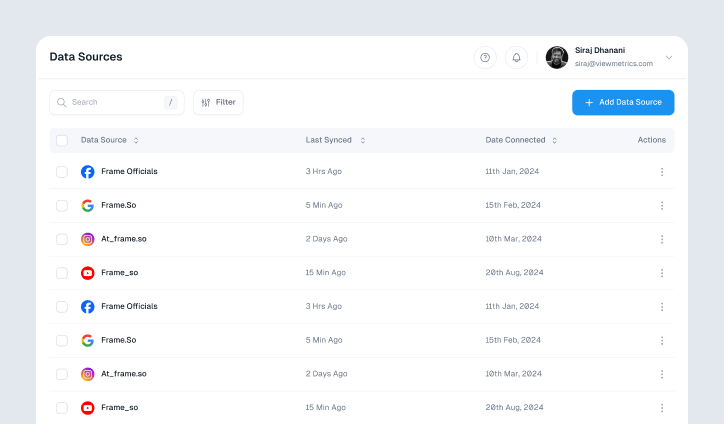
Connect with Ease
Integrate effortlessly with leading platforms to streamline workflows and maximize efficiency.
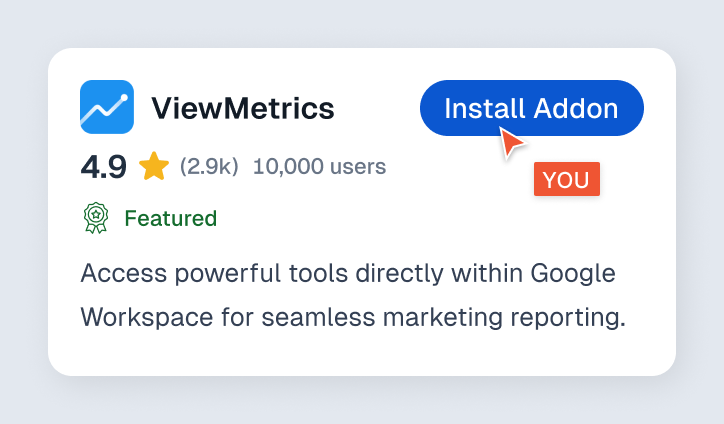
Boost Productivity with Google Add-On
Access powerful tools directly within Google Workspace for seamless marketing reporting.
Custom Reports, Instant Insights
Generate tailored marketing reports effortlessly, delivering key insights in just a few clicks.
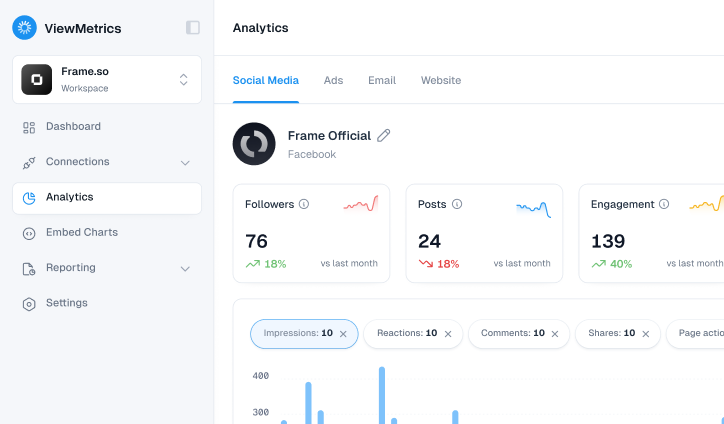
Actionable Analytics at a Glance
Access in-depth analytics to uncover trends, optimize strategies, and drive impactful decisions.
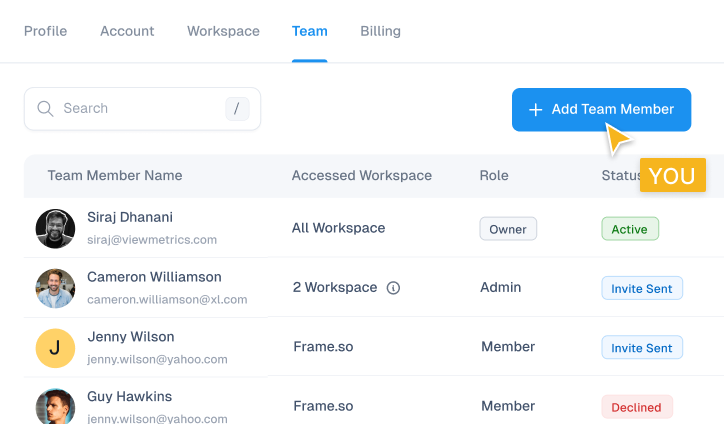
Collaborate with Ease
Invite team members to share insights, streamline workflows, and work together seamlessly.
Design That Stands Out
Elevate visuals effortlessly with customizable styling options tailored to match brand aesthetics.
Effortless Data Syncing
Keep insights up-to-date with seamless and flexible data synchronization across platforms.
Connect with Ease
Integrate effortlessly with leading platforms to streamline workflows and maximize efficiency.
Boost Productivity with Google Add-On
Access powerful tools directly within Google Workspace for seamless marketing reporting.
Custom Reports, Instant Insights
Generate tailored marketing reports effortlessly, delivering key insights in just a few clicks.
Actionable Analytics at a Glance
Access in-depth analytics to uncover trends, optimize strategies, and drive impactful decisions.
Collaborate with Ease
Invite team members to share insights, streamline workflows, and work together seamlessly.