Summary for the Blog
- Dashboards display live, real-time data and are highly visual. They are used for continuous tracking, immediate decision-making, and spotting trends as they happen.
- Reports are static, detailed summaries of past performance over a specific period (e.g., a week, month, or quarter). They are used for in-depth analysis, understanding historical trends, and making long-term strategic decisions.
- The primary distinction is their purpose: dashboards are for real-time monitoring, while reports are for historical analysis.
Data is everything in today’s fast-paced business world. Business companies can evaluate their performance based on the data available. They can plan strategies and make decisions as well, depending on the data they collect.
There are two specific ways to analyze data: dashboards and the other is reports.
In this article, we will help you understand their difference in simple terms and which one to pick when:
Dashboard vs Report – Key differences
To be able to use the right platform to get adequate information, it is important to understand the difference between the two.
Here is a comparison to highlight how dashboards are different from reports.

| Report | Dashboard |
| Gives updates and information analyzed over a period of time and does not give real-time updates. | Gives live updates and insights as soon as they occur. |
| Gives an in-depth, detailed analysis of a particular campaign or project | Allows you to monitor multiple campaigns at the same time |
| Created on a weekly, monthly, and quarterly basis | Provides round-the-clock access to data as and when needed. |
| Focuses on past performances to recognize trends | Focuses on current trends to make immediate decisions. |
Learn More – Marketing Reports: Definition, Benefits, & Elements to Include
What is a Dashboard?
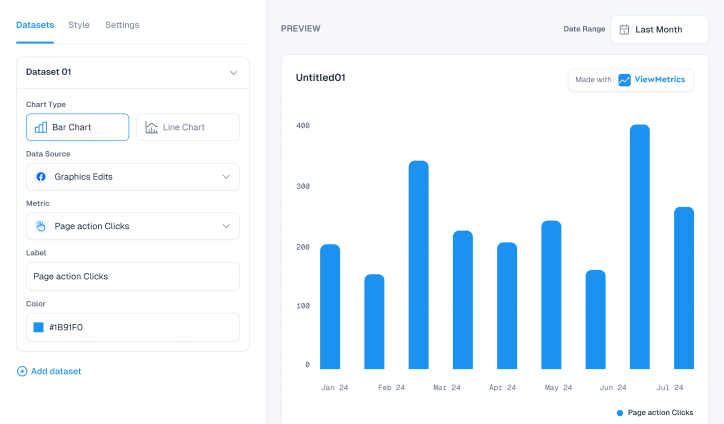
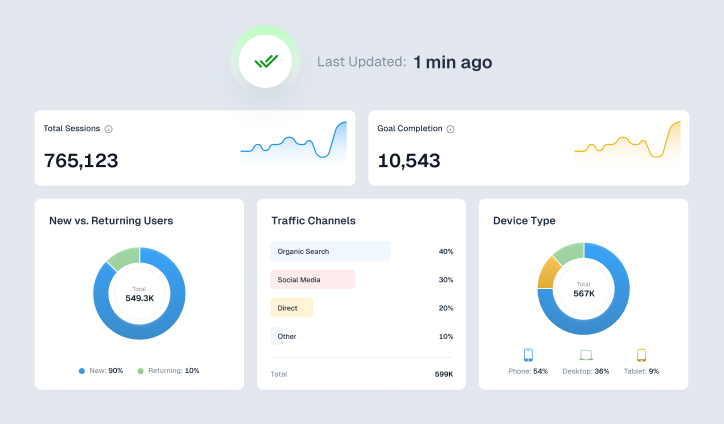
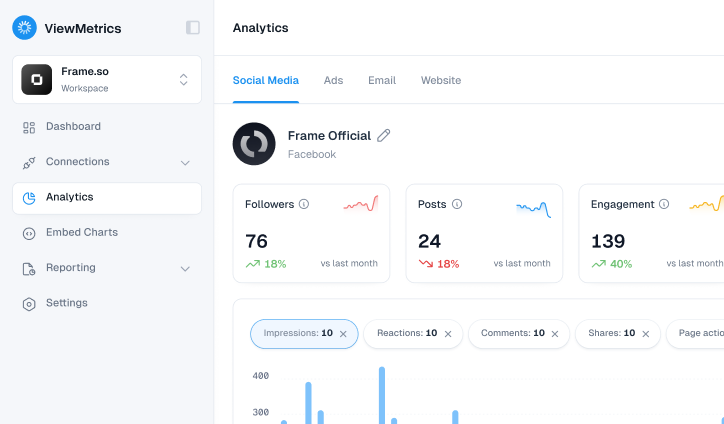
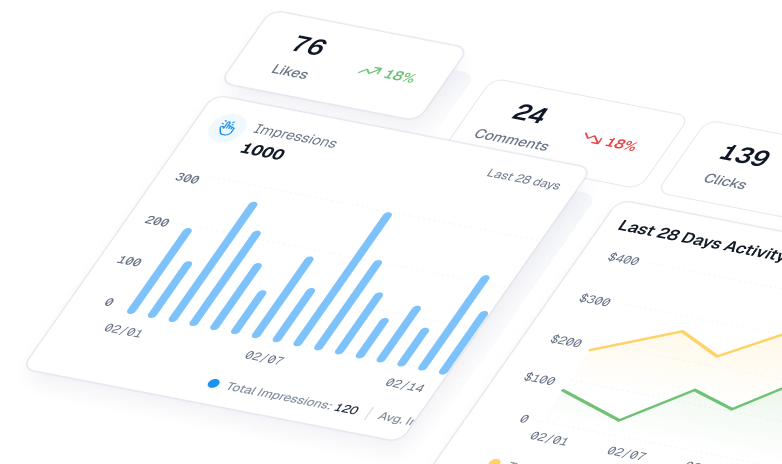
A dashboard is visual; it shows you live data as it changes. Dashboards can be customized to give you any information that you need. Dashboards are the control panels that give you real-time information.
For example, when you want to keep track of the everyday performance of your employees, a dashboard is perfect for them. It gives you the latest information with the latest numbers, so you can plan accordingly.
Learn More – What Is a KPI Dashboard & How to Create One With Examples?
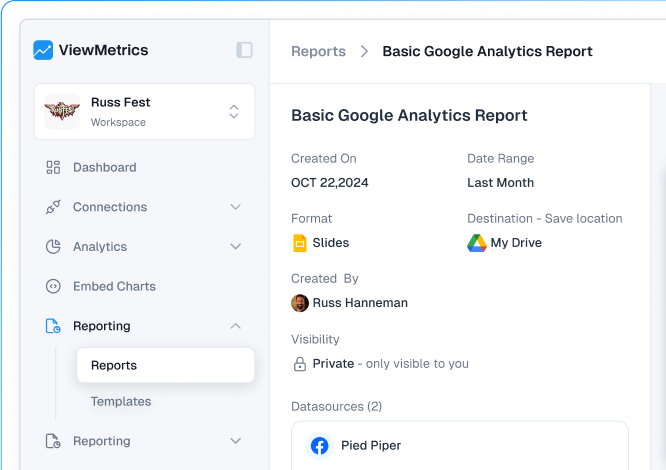
What is a Report?
A report is more of a summary in detail of how things have gone over a period. Reports don’t update regularly like dashboards, they are prepared weekly, monthly, or quarterly and provide an in-depth analysis.
Reports are perfect when you want to have a look at performance over time to make long-term decisions by understanding trends and how things have flown for a certain period.
Learn More – Marketing Reports
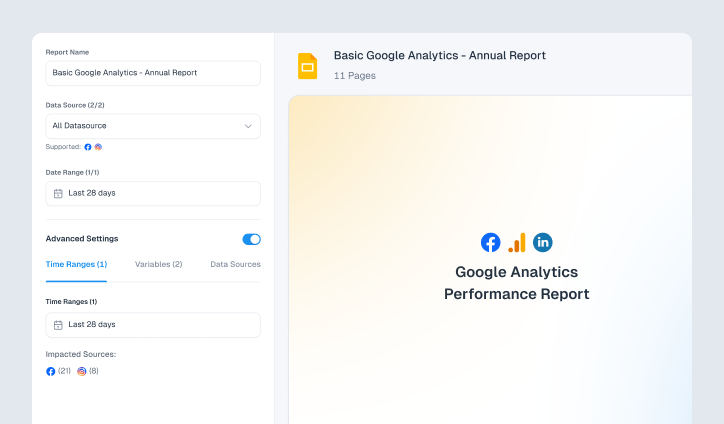
Create Professional Marketing Reports in Minutes – Automate data collection and generate insightful reports effortlessly.


View All Your Marketing and Website Data - Instantly
 Connect Instagram, Mailchimp, Google Analytics & more
- Pre-built dashboards, no setup needed
- Save hours on reporting every week
When Should You Use Dashboard and Report?
Both dashboards and reports are useful depending on your requirements. They serve different purposes and you need to know when to use which.
Use a Dashboard When:
- You need real-time information
- You need to track continuous progress
- You need to give more control to your clients
- You want to detect problems early
Pro Tip: Use ViewMetrics’ dashboards and report templates to stay up-to-date on marketing performance.
View All Your Marketing and Website Data - Instantly
- Connect Instagram, Mailchimp, Google Analytics & more
- Pre-built dashboards, no setup needed
- Save hours on reporting every week
Use a Report When:
- When you need to make long-term decisions
- You need a detailed summary of the performance
- Your focus is on getting better long-term results
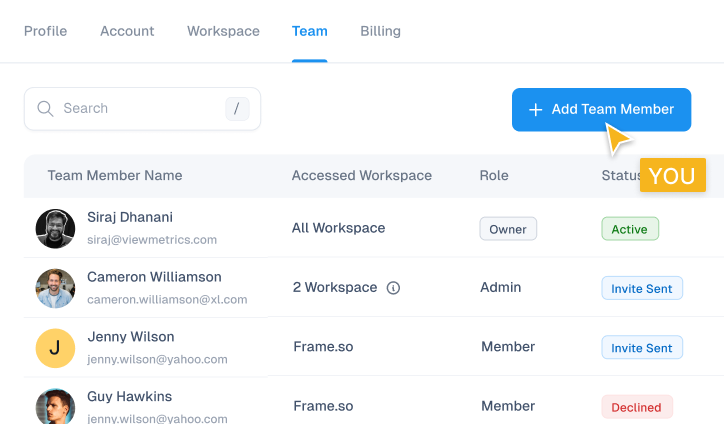
- You need to share information from one department to another
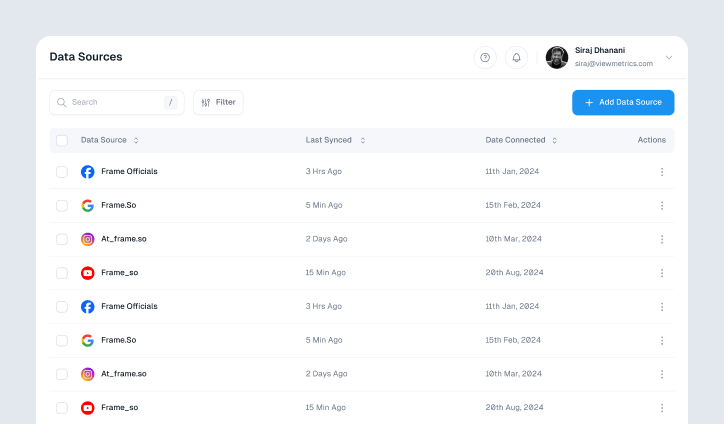
How ViewMetrics Can Help You Create Dashboards and Reports?
ViewMetrics gathers relevant data from all your marketing platforms. It saves you the hassle of manually collecting data automates the creation of marketing reports, connects to your marketing accounts, and generates reports automatically, saving you time and effort.
Conclusion
Both dashboards and reports are essential to understand business data and the progress of business. But the purpose they serve is different, as dashboards are relied on for minute-to-minute updates, whereas reports are relied on to see progress over time in detail. By simply understanding when to use which, you can run a successful business and make better and more informed decisions.
Frequently Asked Questions About Dashboard vs Report
-
Do dashboards update in real time?
Most dashboards auto-refresh using live or scheduled data connections, but update frequency depends on your tools and data sources. -
Are dashboards easier to understand than reports?
Yes, dashboards use charts, KPIs, and visuals that simplify complex data, making them more intuitive for quick insights.
-
What type of information should be included in reports?
Detailed data tables, explanations, context, comparisons, timelines, and insights that require narrative.
-
Can a dashboard be turned into a report?
Many tools let you export dashboard visuals into PDFs or static reports, but they may lose interactivity.
Which one is better for sharing with clients or teams?
Reports are better for formal sharing, while dashboards are ideal for internal, ongoing performance monitoring.
-
Is a dashboard suitable for large datasets?
Dashboards work well for summaries, but extremely large datasets may need reports for full detail analysis.