Summary for the Blog
- Automated reporting is the process of using software to generate reports on a set schedule without manual effort.
- The key benefits of automated reporting include saving time, improving accuracy, and boosting efficiency by freeing up time for strategic planning.
- Automated reports are customizable and can be tailored to specific client needs.
- Automated reporting reduces dependency on manual work, allowing you to focus on high-level strategies.
The digital world is moving at rocket speed, every day there is something new to learn, and if you want to stay on top of your game, you have to work smart, not hard. For marketing professionals, small business owners, and content creators automated reporting is a game changer. It simplifies your work, helps you save time, and helps you focus on what matters when you are looking to grow your business.
Let’s understand how automated reporting works.
What is Automated Reporting?
Automated reporting is the process of generating reports without manual effort. It uses software to collect, analyze, and present data on a set schedule. Businesses use automated reporting to track performance, save time, and reduce errors.
- Saves Time: Repetitive tasks like copy and paste can be eliminated. When you switch to automated reporting, you get more time to plan strategically.
- Improves Accuracy: Human errors occur but when you switch to automated reporting, gives you data that is consistent and correct.
- Real-Time Insights: You will never have outdated information because automated systems give you live data updates.
- Better Transparency: Your work with automated systems becomes more transparent and trustworthy because your clients have direct access to their reports.
- Customizable Reports: You can customize your brand as per your client’s needs.
Also Read: Ad Hoc Reporting: Definition, Benefits and Challenges
Benefits of Automated Client Reporting
Automated client reporting isn’t just convenient—it’s a smart move for anyone looking to stay efficient and professional. Here are the main perks:
1. Saves Time
Automated reporting tools collect data from all your platforms and combine it into one report. Tools like ViewMetrics even handle the design for you, pulling in metrics, charts, and screenshots into pre-designed templates. This means no more juggling between multiple tools and spreadsheets.
2. Improves Accuracy
Manual data entry can lead to mistakes. ViewMetrics keeps everything accurate by using consistent formulas and calculations every time. Also, since your reports work with real-time data, your reports will always be up-to-date.
3. Customizable Reports
With ViewMetrics, you can design templates in Google Slides or Sheets and let the tool do the rest. It automatically adds your data, making your reports look professional and tailored to your client’s preferences
4. Boosts Efficiency
When you collect data, format it, and design a report, you can end up spending a lot of time. ViewMetrics looks after all of this. it gives you time to analyze data and strategize for your clients.
5. Improves Transparency for Clients
Clients want to see clear and honest progress. With ViewMetrics. It helps you set up workspaces where your clients can view their reports in real-time. It makes it easier for clients to track progress and makes you more confident about your work.
6. Shows Professionalism
Clean, consistent, and visually appealing reports show that you are serious about your work and delivering quality. ViewMetrics makes this simple by automating the creation of polished, ready-to-share reports.
7. Reduces Dependency on Manual Work
Automation takes care of all the load of spending hours gathering data and building reports. ViewMetrics collects, formats, and organizes everything for you, giving you more time to focus on big-picture strategies.
Core Components of Automated Reporting
Automated reporting relies on key components that work together to simplify data collection, analysis, and presentation. These elements ensure accuracy, speed, and consistency across all your reports.
- Data Integration – Connects your reporting tool to platforms like Google Analytics, Ads, Meta, CRM systems, and more, pulling all data automatically without manual exports.
- Real-Time Data Syncing – Continuously updates your metrics using live or scheduled syncing so your reports always reflect the latest performance.
- Pre-Built & Customizable Templates – Provides ready-made templates while allowing full customization to match brand style, layout, and reporting needs.
- Automated Data Visualization – Automatically generates charts, KPIs, and graphs from your data, turning raw numbers into clear, visual insights.
- Scheduling & Auto-Delivery – Lets you schedule reports to be generated and delivered to clients or teams automatically—weekly, monthly, or on any timeline you choose.
- Multi-Source Data Consolidation – Combines data from all your platforms into one unified report, eliminating the need to switch between multiple tools.
- Custom Metrics & Calculations – Allows you to create and reuse custom formulas and KPIs, ensuring consistent and accurate calculations every time.
- Collaboration & Sharing Features – Offers shared links, client workspaces, and access controls so teams and clients can view reports in real time.
- Version Control – Keeps a record of previous reports, making it easy to compare performance and track changes over time.
- Security & Governance – Ensures data privacy with permissions, encryption, and compliance controls.
Also Read: 11 Best Report Automation Tools to Boost Insights
How to Create Automated Reports for Your Clients Using ViewMetrics?
Setting up automated reporting with ViewMetrics is simple. Here’s how to get started:
Step 1: Sign Up for ViewMetrics
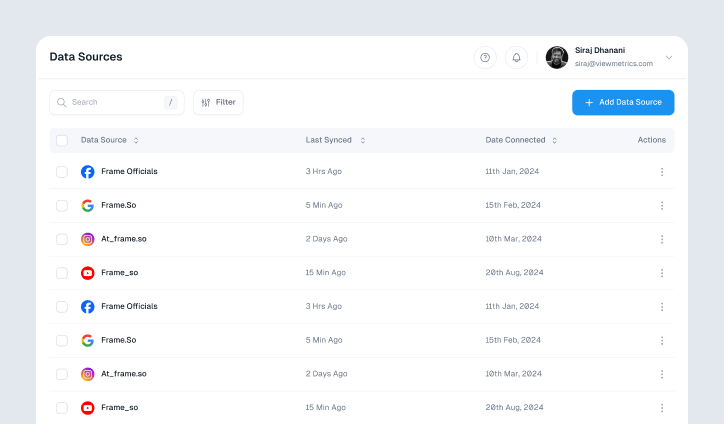
If you’re new to ViewMetrics, create an account and allow the tool to connect to your data sources.
Step 2: Link Your Data Sources
- For Social media accounts, you need to monitor engagement, follower growth, and campaign results from platforms like Facebook, Instagram, and Twitter.
- For ad platforms, you need to keep tabs on ad performance, clicks, and conversions with tools like Google Ads and Facebook Ads.
- For email marketing tools you need to analyze open rates, click-through rates, and subscriber growth from tools like Mailchimp or HubSpot.
Step 3: Connect Google Drive
Link your Google Drive to store all your generated reports securely and access them easily.
Step 4: Create Your First Report
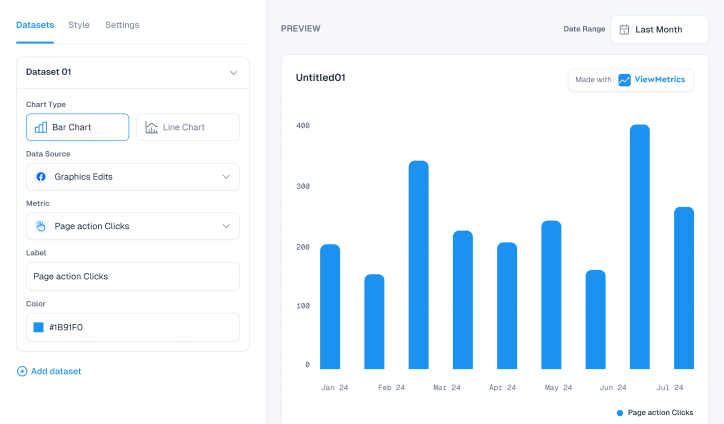
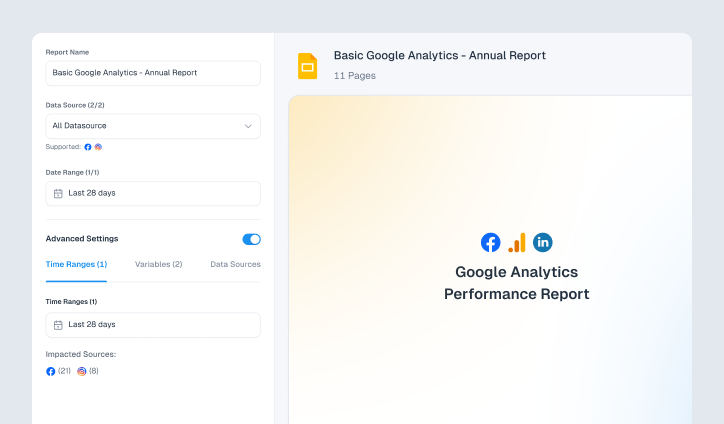
Choose a template, select your data sources, and customize settings like time range. ViewMetrics will generate a polished report branded with your logo and marketing data.
Step 5: Review Reports on the Dashboard
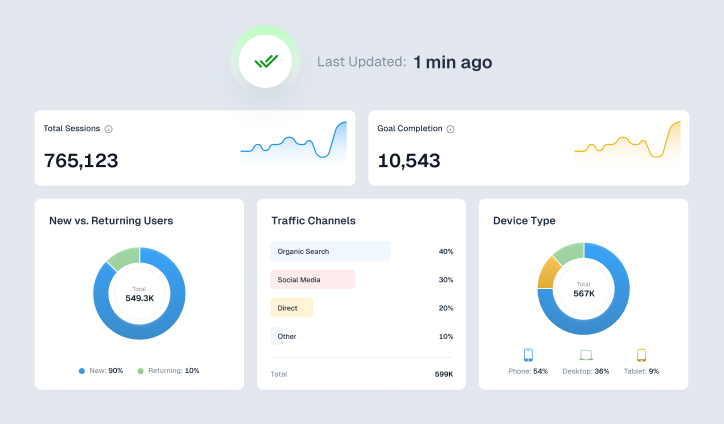
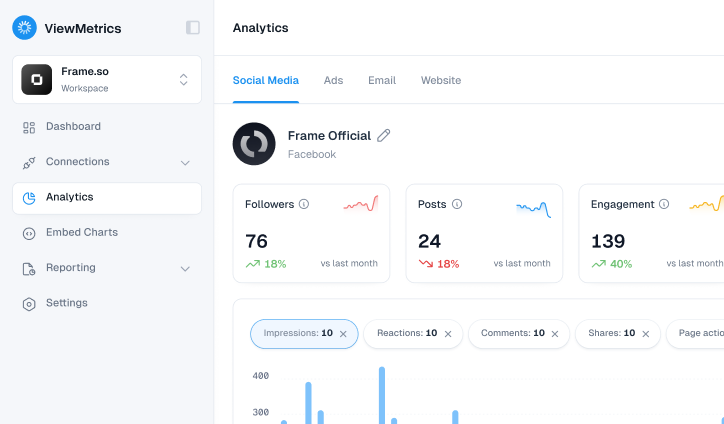
From the dashboard, you can see all your reports in one place along with their data sources.
Step 6: Customize Your Dashboard
You can set up our dashboard by highlighting the data metrics and reports that matter the most to you and your clients.
Step 7: Finalize Your Report
Pick a template, adjust the date range, select your preferred format, and let ViewMetrics do the rest. Your report will be ready to review and share.
Use ViewMetrics’ Report Templates to instantly create marketing reports.
Learn More – How to Create a Report Using Excel?
Automated reporting is a very useful time-saving tool. It improves your accuracy and helps your business build better client relationships. Professional and customized reports are now easy to generate with tools like ViewMetrics. Take the automation leap and focus on what really matters. Grow your business and deliver the best today.
ViewMetrics is your all-in-one solution for marketing reporting—from automation to custom dashboard creation. Streamline your analytics today!


